
|
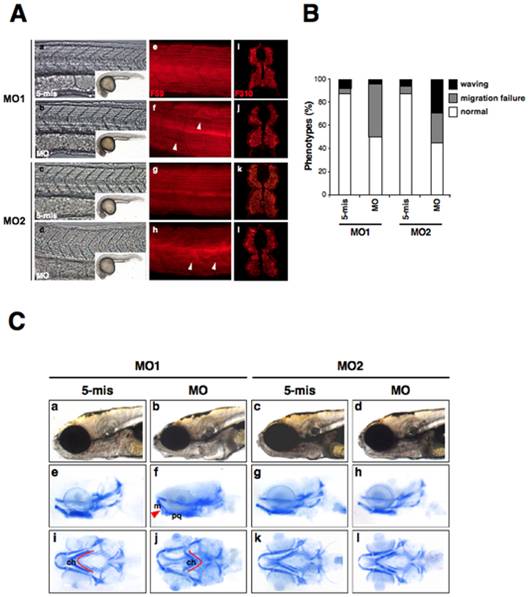
Fig. 4 The knockdown of zebrafish lamin A/C induces laminopathies associated with muscular dystrophy and craniofacial abnormalities.
(A) Muscle fiber visualization in zlamin A/C-knockdown embryos. (a–d) The left panels show a lateral view of the entire embryo bodies and a magnified bright field view of the somites. (e–h) Lateral views of MO-injected embryos at 24 hpf stained with the F59 antibody (adaxial cells/slow muscle fibers). In panel (f), white arrowheads indicate broken or missing muscle fibers. In panel (h), white arrowheads indicate the wavy muscle fibers in compared with control embryos. (i–l) The right panels show cryostat sections of 48 hpf LMNA-MO injected embryos stained for fast muscle fibers (F310). (B) Percentage of muscle phenotypes scored for MO-injected embryos at 24 hpf. The graph shows the distribution of phenotypes observed following injections with 4 ng of MOs. Migration failure in embryos is represented in gray and wavy muscle fibers in black. The percentage of each muscle phenotypes ‘waving’, ‘migration failure’, ‘normal’ were, respectively, MO1-5mis; 7.5%, 5.0%, 87.5%; MO1-MO; 3.8%, 46.2%, 50.0%; MO2-5mis; 6.1%, 6.1%, 87.8%; MO2-MO; 29.4%, 25.5%, 45.1%. (C) Cartilage in 6 dpf larvae were stained with Alcian blue and then whole-mounted. (a–d) Lateral views of the head portions of living larvae are shown in the top panels. (e–h) Lateral view of Alcian blue stained larvae. (i–l) Ventral views of Alcian blue stained larvae. The red lines indicate the ceratohyal articulates (ch), and the red arrow indicates the Meckel′s (m) to palatoquadrate (pq).