
|
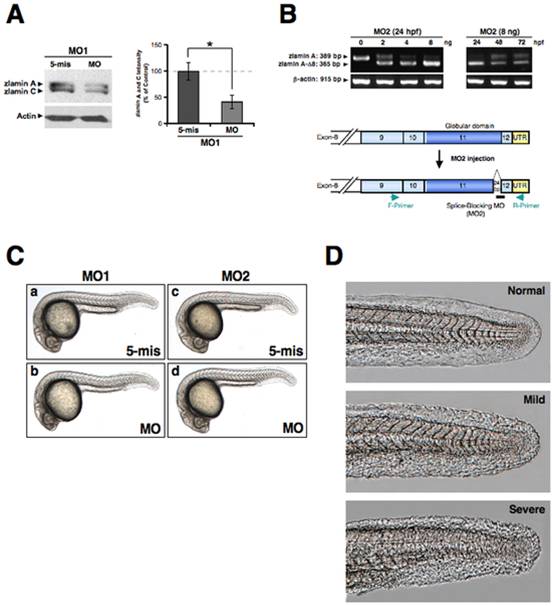
Fig. 2 Knockdown of zebrafish lamin A/C.
(A) Western blot analysis of intrinsic lamin A/C in the zebrafish AB9 cells transfected with MOs. The lower panel of blotting shows the actin control (*P<0.01). The right-side graph shows the quantitation results for the lamin A and C blot intensities standardized by the control actin levels from three-independent experiments. (B) Agarose gel electrophoresis of the RT-PCR products of zlamin A from embryos injected with the indicated concentrations of zLMNA-MO2. The primers used recognize exon 9 (forward primer; F-Primer) and the 3′-untranslated region (reverse primer; R-Primer). Sequence analysis revealed that the injection of zLMNA-MO2 induces a 24 bp deletion in the rear part of exon 11. Left panel, total RNA was extracted from 24 hpf embryos after MO injection. Right panel, embryos were injected with 8 ng MO and total RNA was extracted from 24 to 72 hpf as indicated. Lower panel, the corresponding positions of the F-Primer, R-Primer, and MO2 are schematically presented. (C) Gross morphology of zlamin A/C-knockdown embryos. Lateral views of MO-injected embryos (4 ng) at 24 hpf are shown. (a) 5-base mismatch control MO1 (MO1, 5-mis), (b) zLMNA-MO1 (MO1, MO), (c) 5-base mismatch control MO2 (MO2, 5-mis), (d) zLMNA-MO2 (MO2, MO). (D) Occasionally observed rough skin phenotypes (Mild and Severe) in MO2-morphant tails are shown by comparison with a normal skin phenotype (Normal) in the wild-type tail.