
|
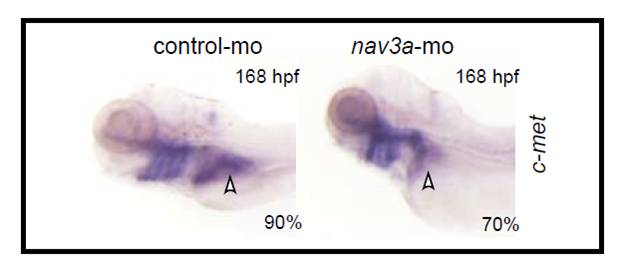
Fig. S13 Expression of the liver marker c-Met in controls and Nav3a morphants. Nav3a depletion resulted in reduced hepatic c-Met expression in the growing liver. Embryos injected with control morpholino (left panel) or Nav3a-ATG blocking morpholino (right panel) were examined for expression of c-Met by in situ hybridization. The percentage of embryos exhibiting a similar expression pattern is indicated in the lower right corner (n=20/group). In Nav3a morphants hepatic c-Met expression was greatly reduced at 168 hpf, indicating a reduced liver size (white arrowhead, right panel). The images show a left-lateral view.