
|
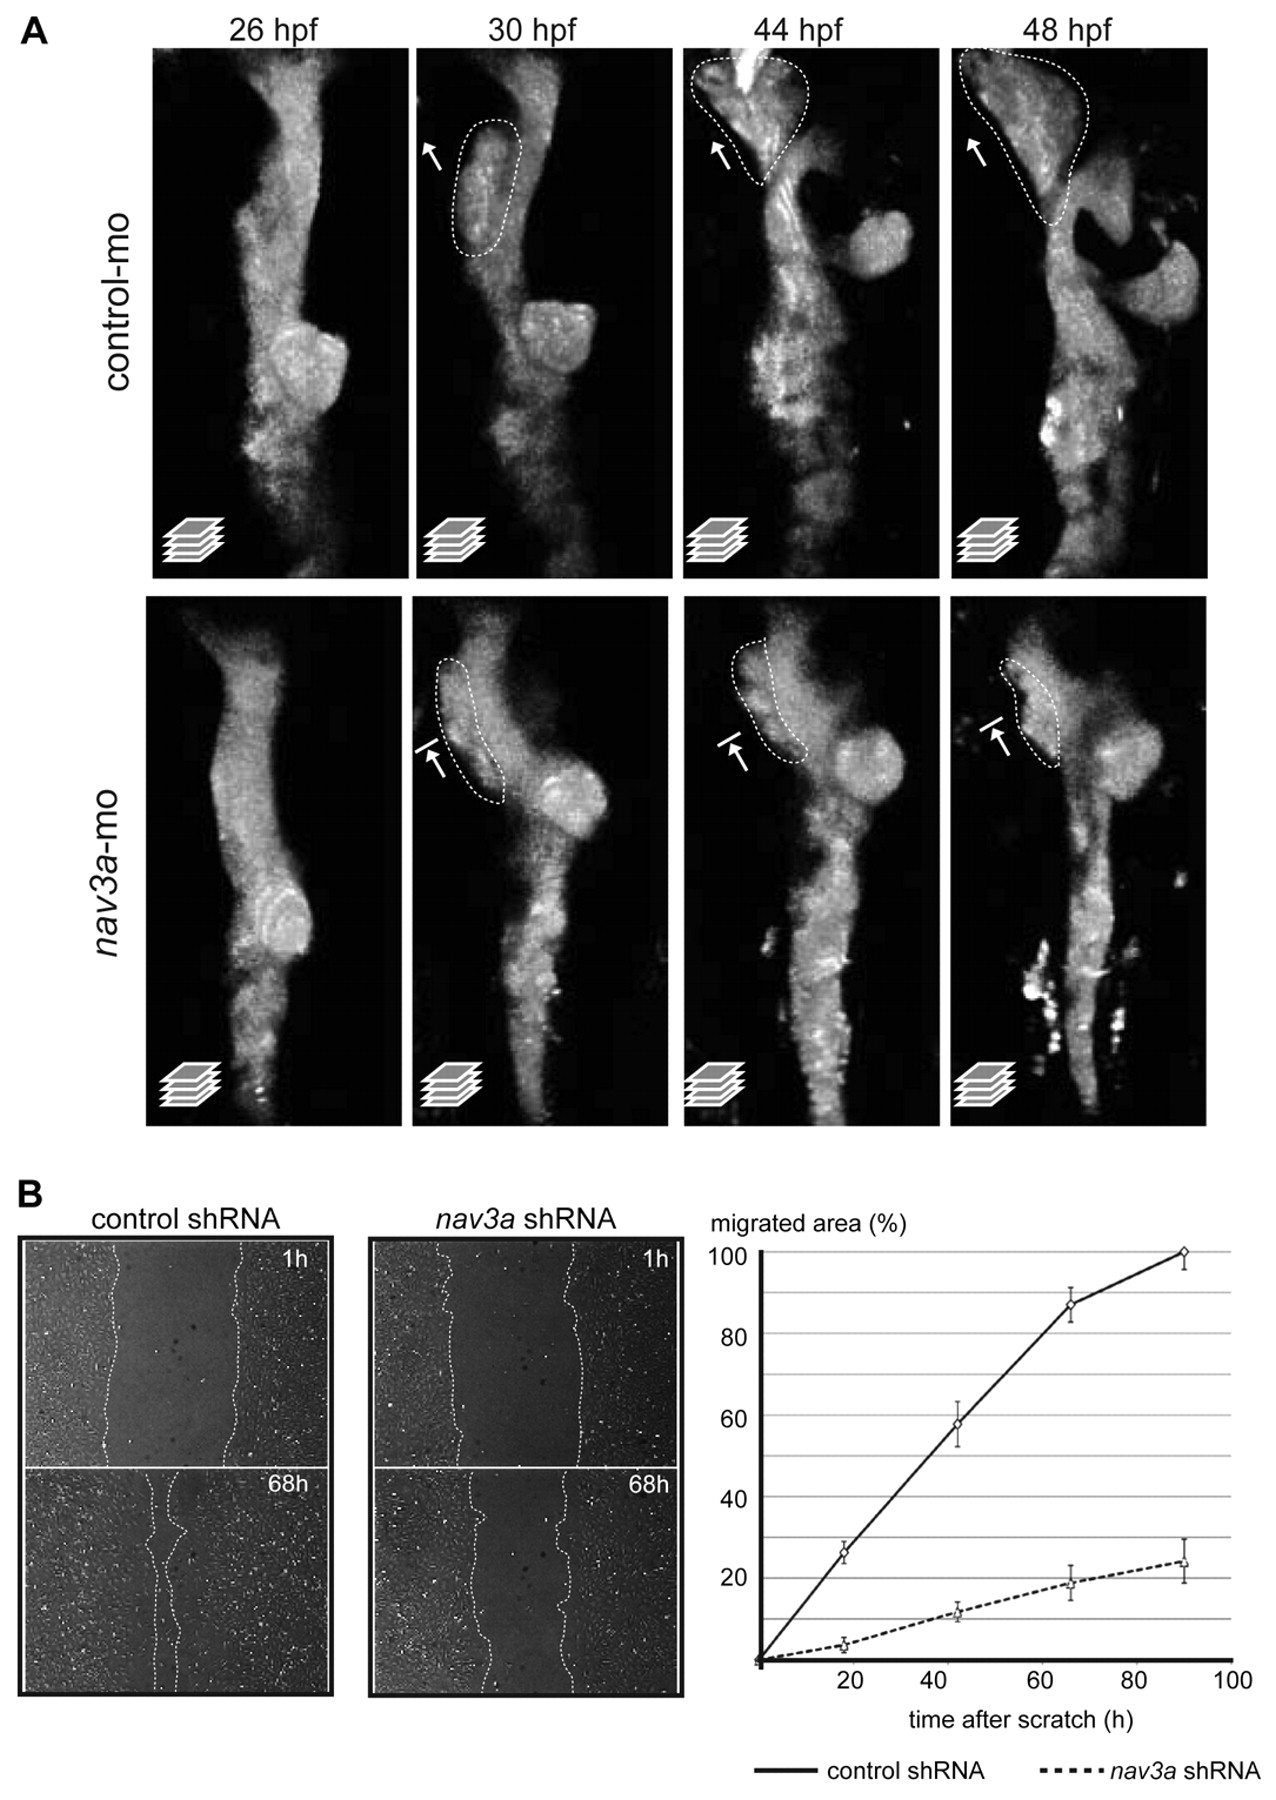
Fig. 3 Nav3a controls hepatoblast movement from the intestinal endoderm. (A) Confocal time-lapse imaging of liver development in sox17:gfp embryos 26-48 hpf after injection of control morpholino (upper panels) or nav3a-ATG morpholino (lower panels). In control embryos, the endodermal rod thickened (upper panel, 26 hpf). Subsequently, a cell population on the left side, cranial to the pancreatic bud separated from the intestinal endoderm (upper panel, 30 hpf) and migrated in a leftward direction to form the liver bud (upper panels, 30-48 hpf). Nav3a depletion reduced outgrowth of hepatoblasts resulting in a smaller liver bud (lower panels, 30-48 hpf). All images show a dorsal view; dotted lines demarcate putative hepatoblast populations and arrows depict outgrowth direction. (B) Pac-2 zebrafish cells stably expressing control shRNA or nav3a shRNA were analyzed in an in vitro scratch-migration assay. Confluent monolayers were scratched and at the indicated time points the migrated area was measured in control (B, left panels) and nav3a knockdown cells (B, middle panels). Nav3a depletion significantly reduced the migratory capacity (B, right panel; P<0,001; mean ± s.e.m.); n=6-12 scratched areas from three separate experiments.