
|
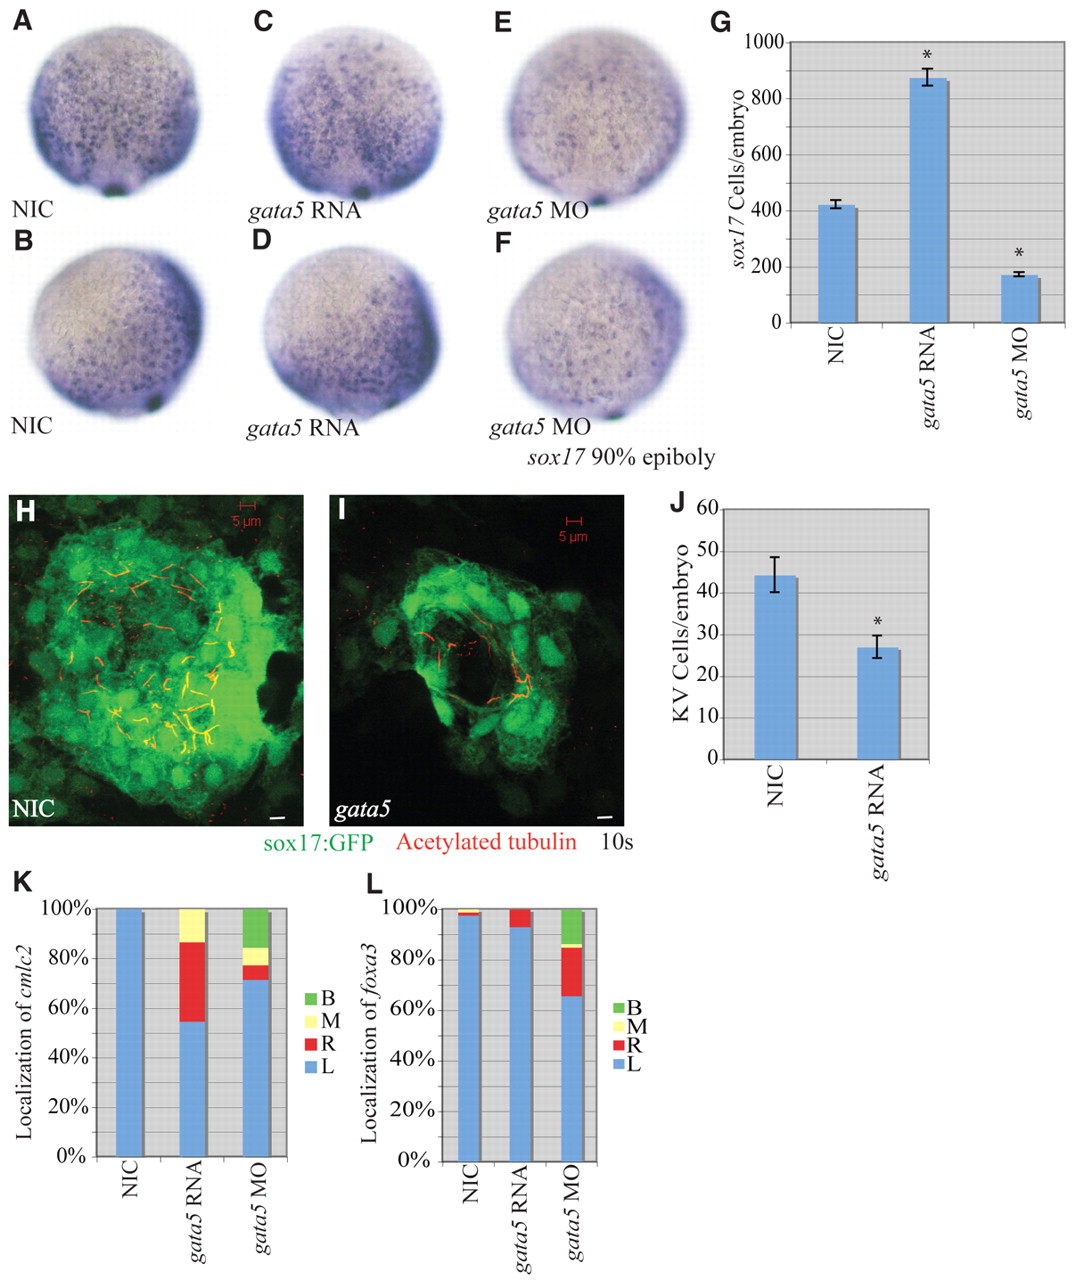
Fig. 4 gata5 effects on early zebrafish development. (A-F) Localization of sox17-expressing cells in wild-type, gata5 gain-of-function and gata5 loss-of-function embryos at 90% epiboly. (A,C,E) Dorsal views with anterior to the top. (B,D,F) Lateral views with dorsal to the right. (G) Numbers of sox17-expressing cells in NICs (n=4), gata5 gain-of-function (n=7) and gata5 loss-of-function (n=8) embryos. Error bars represent s.e.m. *, P<0.01 between injected embryos and NIC; Student′s t-test. (H,I) Confocal z-stacks of KV in NIC and gata5-injected embryos at the 10-somite stage. KVs were labeled using a sox17:gfp (green) transgenic line as above. Motile cilia were labeled with antibodies against acetylated tubulin (red). Scale bars: 5 μm. (J) KV cell number was counted as above. Error bars represent s.e.m. *, P<0.01 between NIC and gata5 gain of function; Student′s t-test. (K) Percentages of left (L), right (R), midline (M) and bilateral (B) localized cmcl2 in NIC (n=49), gata5 gain-of-function (n=75) and gata5 loss-of-function (n=84) embryos. (L) Percentages of left, right, midline and bilateral localized foxa3 in NIC (n=83), gata5 gain-of-function (n=142) and gata5 loss-of-function (n=73) embryos.