
|
Fig. 3
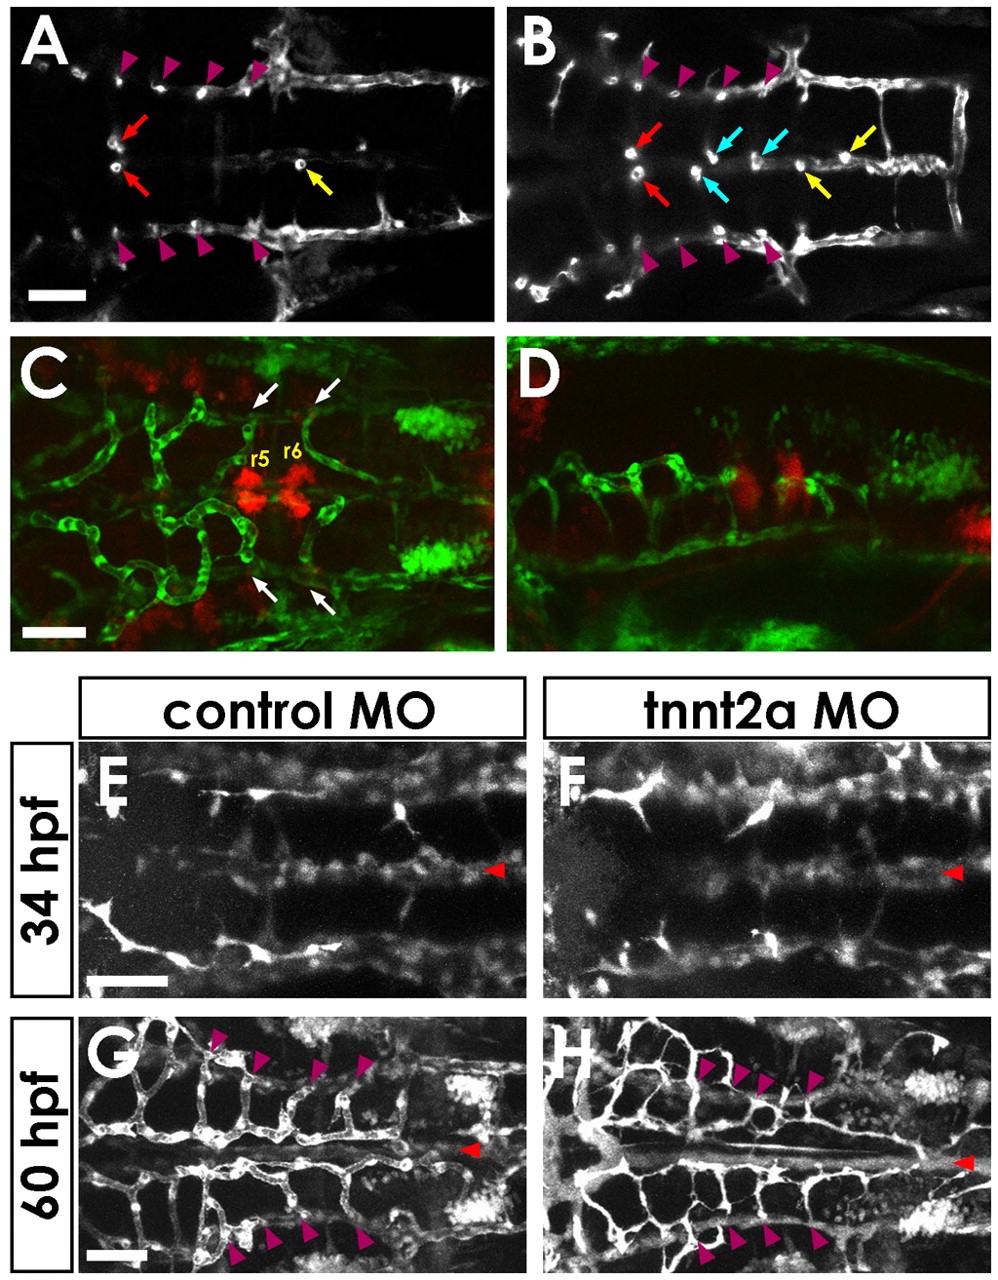
Central artery formation and patterning. (A,B) Single horizontal section through the hindbrains of 54 (A) and 60 (B) hpf Tg(kdrl:GFP) embryos. The CtA in the third rhombomere (r3) links directly to the BA from early stages (red arrows in A), whereas CtAs in r4 and r5 do not initially connect to the BA. One or two direct connections are also usually present in r6 or r7 (yellow arrow in A) by this stage. Direct connections in r4 and r5 are formed later (blue arrows in B). Each stem of the CtAs in r3 to r6 is indicated by a purple arrowhead. (C,D) CtAs avoid Olig2+ clusters in r5 and r6. Dorsal (C) and lateral (D) view of confocal images in a 48 hpf Tg(fli1a:EGFP)y1; Tg(olig2:DsRed2)vu19 double-transgenic embryo, showing DsRed2-positive neuroepithelial precursors (red) and EGFP-positive blood vessels (green). The CtAs in r5 and r6 (arrows) appear to turn away from and avoid the nearby Olig2+ clusters. (E-H) CtAs are patterned normally in tnnt2a MO-injected ‘silent heart’ animals that lack blood circulation. Confocal images of the hindbrain vasculature in 34 (E,F) and 60 (G,H) hpf Tg(fli1a:EGFP)y1 control (E,G) or tnnt2a (F,H) MO-injected zebrafish embryos. BA, red arrowheads; CtAs, purple arrowheads. Dorsal view, rostral to the left. Scale bars: 50 μm.