
|
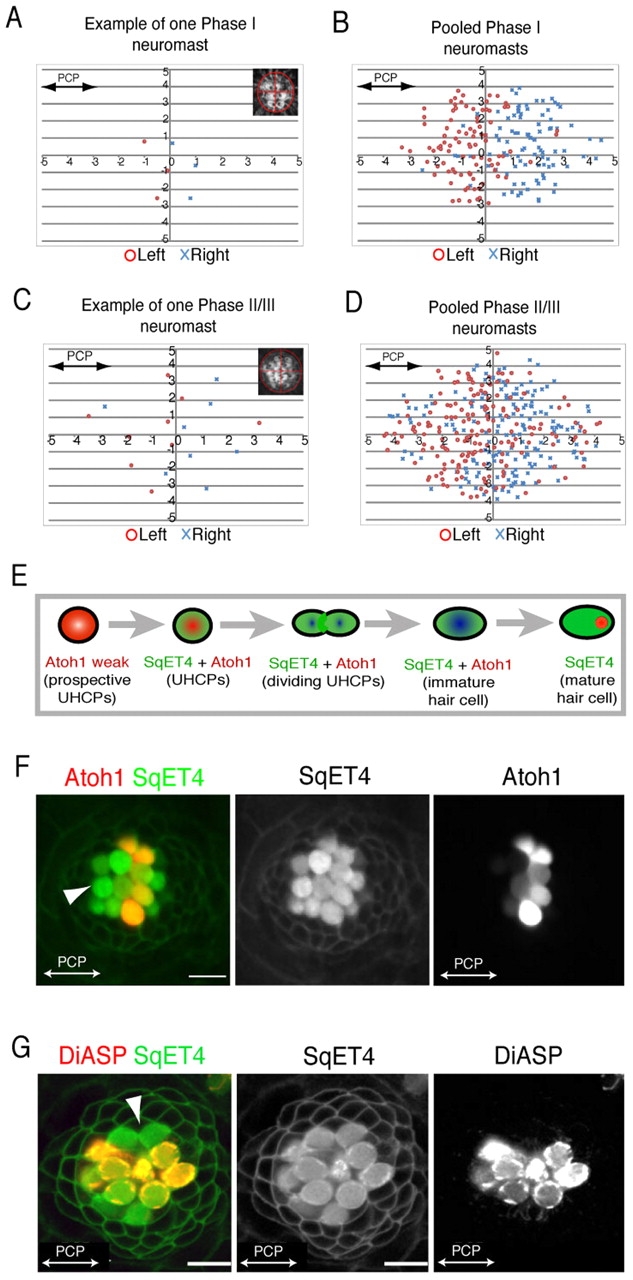
Fig. 5
Local and global planar polarization of the neuromast epithelium. (A-D) Hair-cell planar polarity distribution in regenerating and mature neuromasts. Positional values of each polarity are plotted in a Cartesian plane. (A,B) Example of one neuromast (A) and 20 pooled neuromasts (B) in Phase I. (C,D) Example of one neuromast (C) and 22 pooled neuromasts (D) in Phase II/III. (E) Schematic transition of marker gene-expression in prospective UHCPs [weakly Atoh1a+ (pink)], UHCPs, immature and young hair cells [co-expressing SqET4 and Atoh1a (green/red)], and mature hair cells [exclusively SqET4+ (green)]. (F) A Tg[Atoh1a:TdTomato; SqET4] neuromast exemplifies this transition [GFP(+) UHCPs and hair cells (green) and Atoh1a(+) cells (red)]. The white arrowhead indicates mature hair cells on the rostral part of this parallel neuromast. (G) DiASP incorporation into hair cells of Tg[Cldnb:mGFP; SqET4] neuromast, showing the exclusion of mature hair cells from the polar compartments. The white arrowhead indicates immature hair cells on the dorsal part of this parallel neuromast.