
|
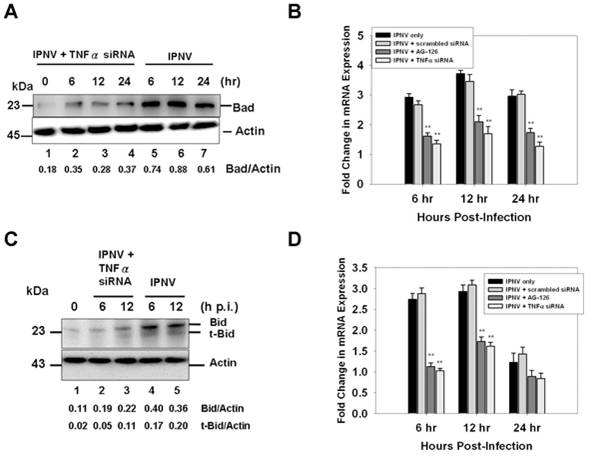
Fig. 3 (A) The expression level of the pro-apoptotic proteins Bad and Bid in IPNV-infected ZF4 cells (MOI = 1) at 0, 6, 12, and 24 h p.i. was determined. The proteins were detected using western blot with a polyclonal antibody specific for mouse Bad. Lanes 1–4: ZF4 cells were pretreated with TNFα-specific siRNA and infected with IPNV for 0 (lane 1), 6 (lane 2), 12 (lane 3), or 24 h (lane 4). Lanes 5–7: untreated ZF4 cells were infected with IPNV for 6 (lane 5), 12 (lane 6), or 24 h (lane 7). The expression of actin was used as an internal control. Results are expressed as the ratio of Bad/actin. The mRNA expression of bad (B) and bid (D) in IPNV-infected ZF4 cells was quantified using quantitative RT-PCR. ZF4 cells were pre-treated with TNFα-specific siRNA or AG-126 and infected with IPNV (MOI = 1) for 0, 6, 12, or 24 h. The expression of ef1a was used as an internal control. Data shown are mean ± SD. Student′s t tests indicate significant differences compared to untreated control: **, p<0.01. (C) The expression level of the pro-apoptotic proteins Bid and t-Bid in IPNV-infected ZF4 cells (MOI = 1) at 0, 6 and 12 h p.i. was determined. The proteins were detected using western blot with a polyclonal antibody specific for Bid. Lanes 2–3: ZF4 cells were pretreated with TNFα-specific siRNA and infected with IPNV for 6 (lane 2) or 12 h (lane 3). Untreated ZF4 cells were infected with IPNV for 6 (lane 4) or 12 h (lane 5). Untreated ZF4 cells were infected with IPNV for 0 h (Lane 1). The expression of actin was used as an internal control. Results are expressed as the ratio of Bid/actin or t-Bid/actin.