
|
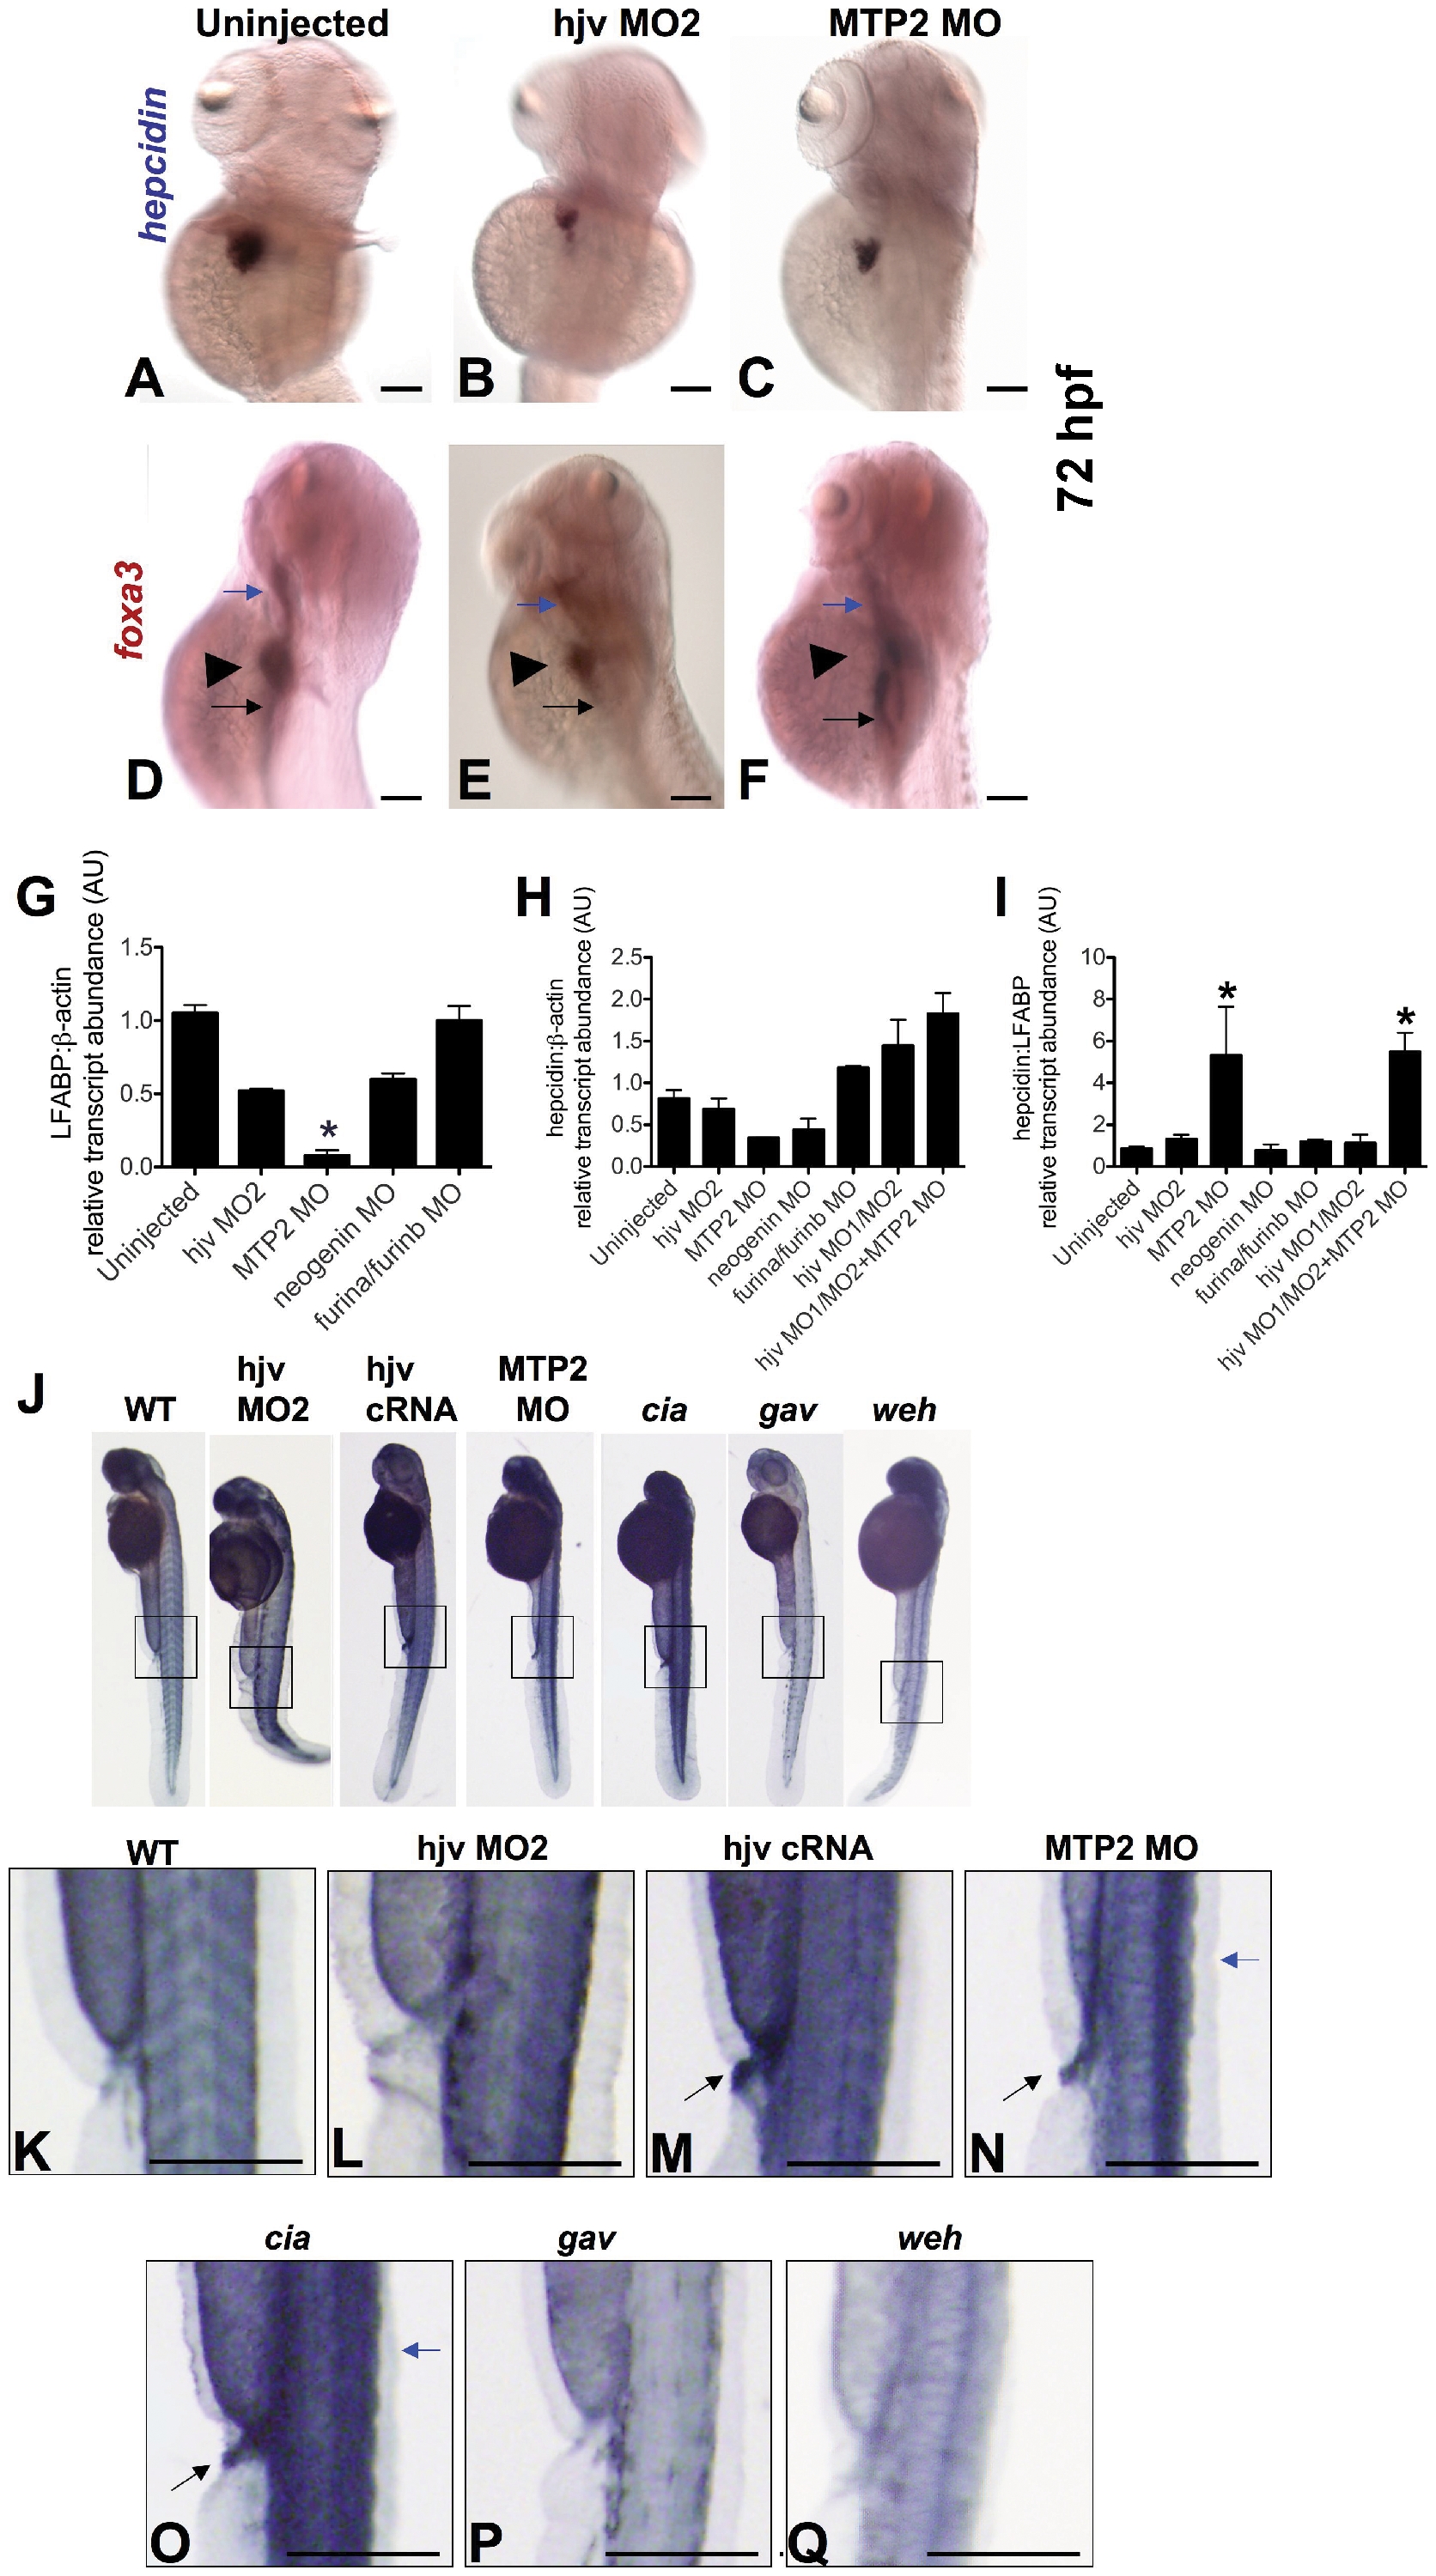
Fig. 7 Knockdown of mtp2 increases hepcidin expression and iron staining in zebrafish embryos.
A–F. Whole mount in situ hybridization at 72 hpf for hepcidin (dorsolateral) (A–C) and foxa3 (lateral) (D–F) in uninjected controls (A, D), compared to morphants of hjv (hjv MO2) (B,E) or mtp2 (C,F). Foxa3 marking the pharynx (blue arrow), liver (arrowhead), and intestine (black arrow) revealed a smaller liver size in hjv morphants (E) and particularly in mtp2 morphants (F). N = 40–45 embryos per group. G–I. Quantitative real-time RT-PCR for the liver specific marker, LFABP, relative to β-actin (G), and for hepcidin relative to the ubiquitous transcript, β-actin (H) or relative to LFABP (I). N = 2–8 pools of embryos per group. Data shown are means ± SE. * denotes p<0.05, compared to uninjected controls. J–Q. Whole mount nonheme iron staining of zebrafish embryos at 55 hpf with 5x additional magnification of boxed regions. We observed normal iron staining in uninjected WT (K) and hjv morphants (L), but increased iron staining (black arrows) in the somites and proctodeum (terminal gut) of hjv cRNA injected (M), mtp2 MO injected (N), erythroid transferrin receptor deficient mutant chianti (cia) (O), and in the dorsal spinal cord (blue arrows) of mtp2 morphants and chianti. As expected, decreased intraembryonic iron staining was observed in the transferrin-a deficient mutant gavi (gav) (P) and in the ferroportin deficient mutant weissherbst (weh) (Q). N = 11–20 embryos per group.