
|
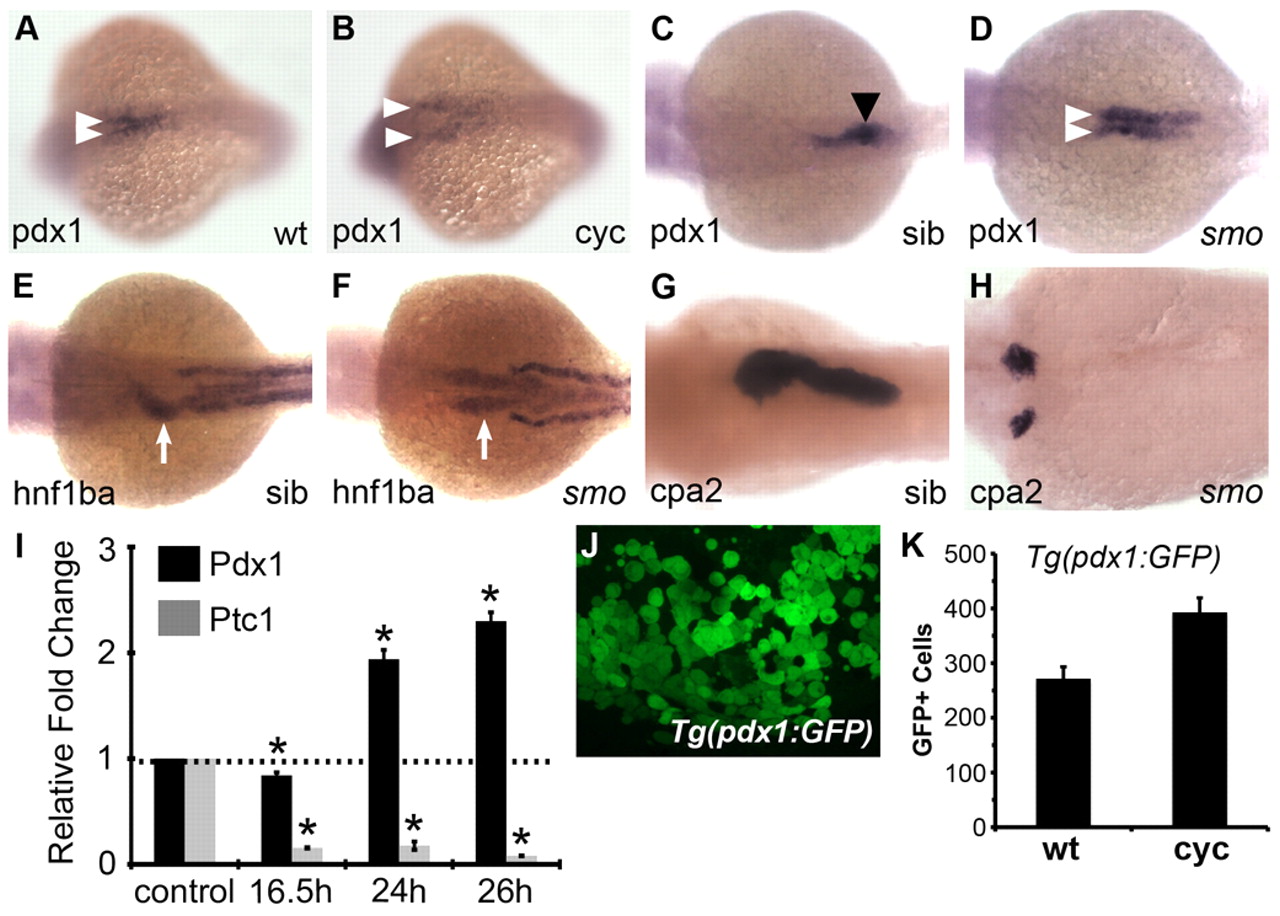
Fig. 1 Pdx1 is increased in Hh-deficient embryos by 24 hpf. (A-D) pdx1 expression at 16.5 hpf (A,B) and 28 hpf (C,D) in wild-type (A,C), cyclopamine-treated (B) and smo1a590 mutant (D) zebrafish embryos. At 16.5 hpf, pdx1-expressing cells (white arrowheads) begin converging at the midline (A), and by 28 hpf they have coalesced into a single cluster corresponding to the dorsal pancreatic bud (black arrowhead) (C). In Hh signaling-deficient embryos, the stripes of pdx1 expression are expanded (D) and remain separated (B,D) as pdx1-expressing cells fail to initiate medial migration. (E,F) hnf1ba expression in the foregut (arrows) at 30 hpf in smo1a590 mutants (F) versus wild type (E). (G,H) cpa2 expression in the exocrine pancreas at 3 dpf in smo1a590 mutant embryos (H) versus wild type (G). All images in A-H are dorsal views, anterior to the left. (I) qPCR of pdx1 and ptc1 expression levels at different developmental stages in embryos lacking Hh signaling (mean ± s.e.m.). Expression of pdx1 was initially reduced at 16.5 hpf but significantly elevated at 24 hpf in cyclopamine-treated embryos as compared with untreated controls and at 26 hpf in smo1a590 mutants as compared with wild-type siblings. Asterisks denote a significant change versus control by at least two s.d. (J) A representative image of dissociated cells from a cyclopamine-treated Tg(pdx1:GFP) embryo at 28 hpf. (K) Quantification of GFP+ cells in untreated (wt) and cyclopamine-treated (cyc) Tg(pdx1:GFP) embryos at 28 hpf. The y-axis indicates the number of GFP+ cells. All cyclopamine (25 μM) treatments were initiated at 2 hpf until harvest.