
|
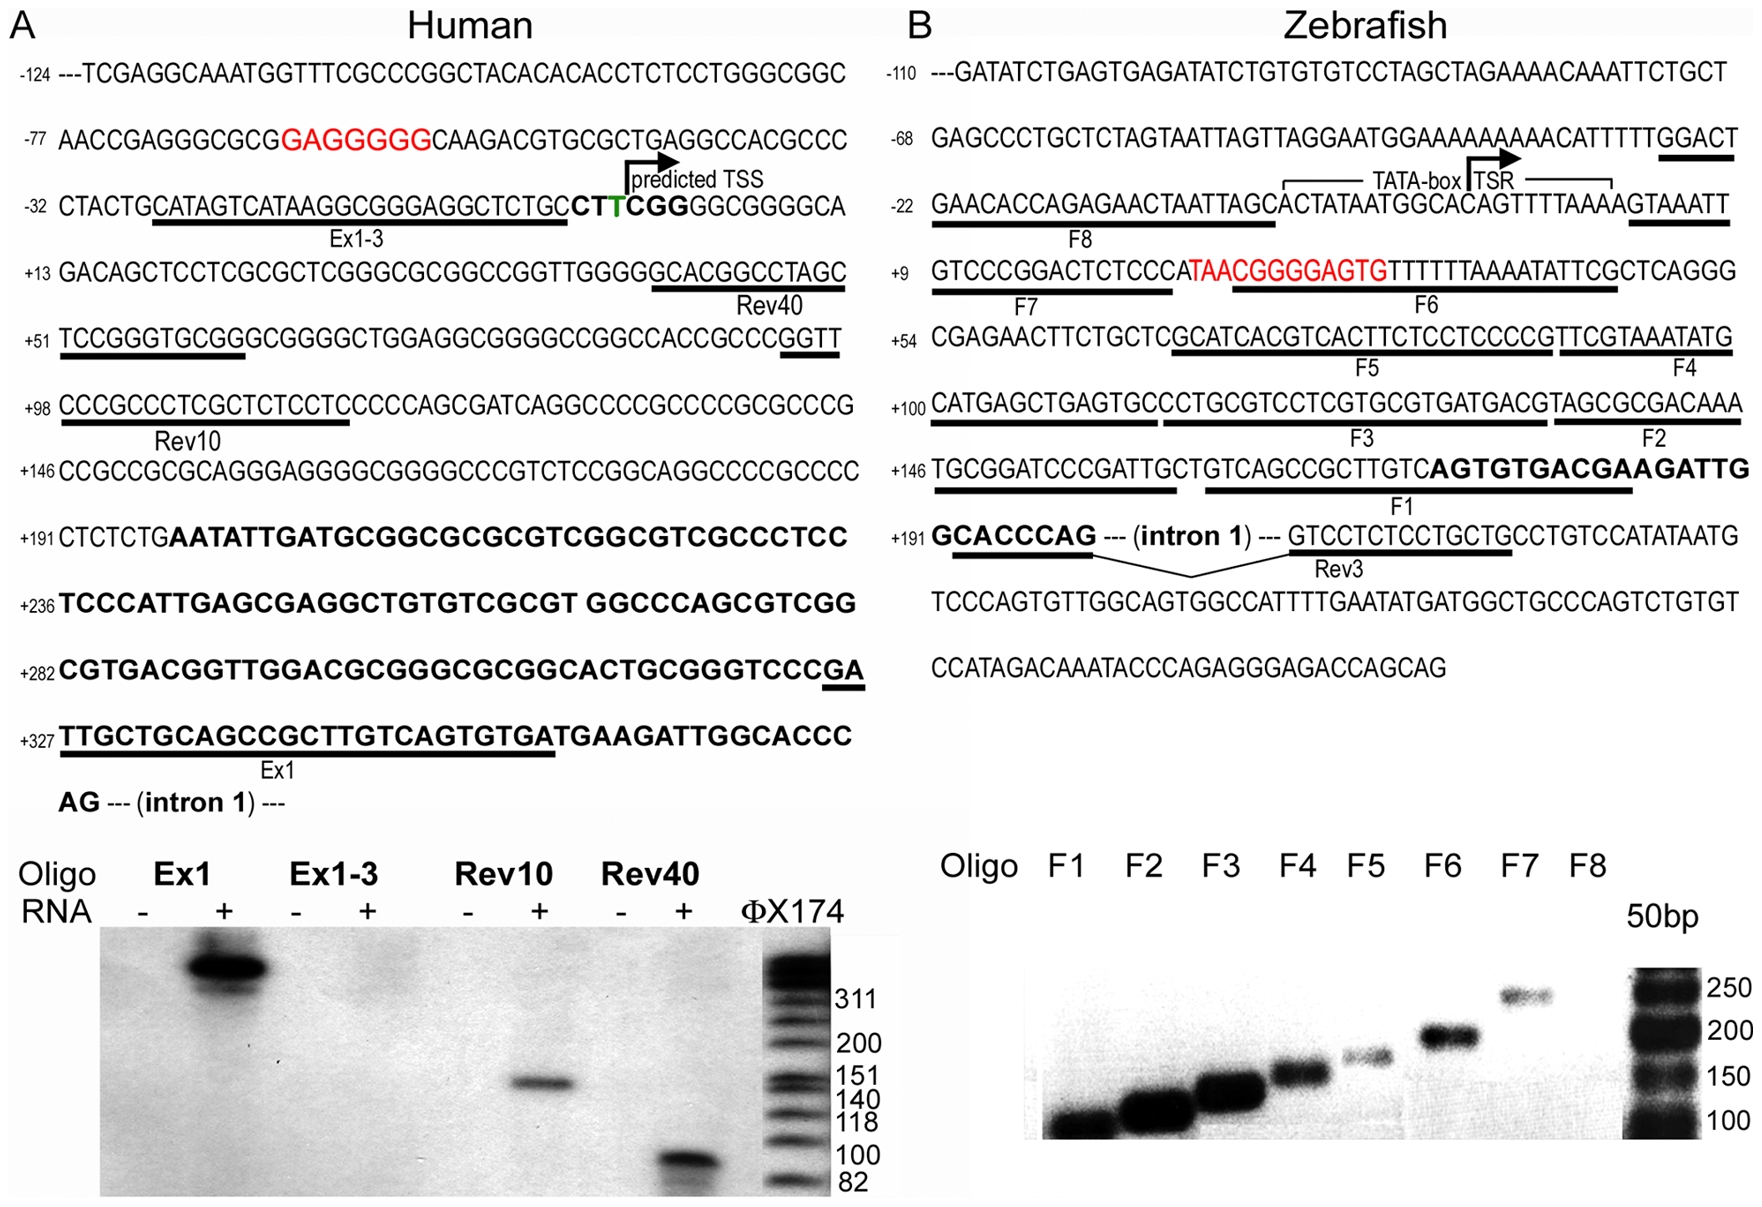
Fig. 1 Determination of the Transcription Start Region of human and zebrafish Prep1 genes.
A) DNA sequence of the region upstream to the published cDNA sequence (shown in bold). Underlined sequences are the primers employed in the primer extension analysis (Ex1-3, Rev40, Rev10 and Ex-1). The red bold sequence identifies an EGR-1 binding element. The predicted transcription start site (TSS) was identified in this experiment on the basis of the migration of the amplified primers. Below, primer extension analysis using HeLa cells RNA and the primers indicated in A. OX174 lanes show the migration of molecular weight markers (indicated on the side). B) DNA sequence of the zebrafish genomic region which includes a predicted TATA box and TSR of prep1.1 gene. Underlined sequences are the primers used for the RT-PCR assay, F0 to F8 and REV3 (see Table 1). The red bold sequence identifies an EGR-1 binding element. Below, agarose gel electrophoresis of the RT-PCR: F7 identifies the last primer able to amplify, together with REV3, the zebrafish cDNA.