
|
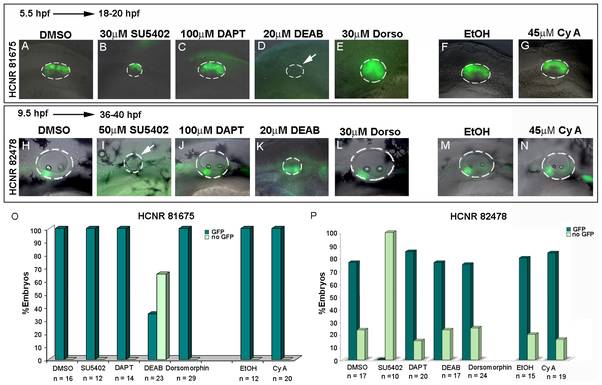
Fig. 3 Distinct signaling pathways regulate activation of pou3f4 HCNR 81675 and HCNR 82478 enhancers.
(A–N) Transgenic embryos for both enhancers were treated with different pharmacological inhibitors from 5.5 hpf stage to 18–20 hpf and 7.5 hpf to 36–40 hpf respectively. Lateral view of HCNR 81675 (A–G) 18–20 hpf staged otic vesicles and HCNR 82478 (F–N) otic vesicles of 36–40 hpf embryos. HCNR 81675 activity was abrogated in the presence of RA signaling inhibitor DEAB (compare D to the control treatment with DMSO in A), whereas Fgf signaling inhibition by SU5402 completely disrupted pou3f4 HCNR 82478 activity (compare I to control treatment in H). Orientation is anterior (left) to posterior (right). (O, P) Graphs representing the percentage of embryos displaying complete inhibition of GFP expression in pou3f4 HCNR 81675 (O) and HCNR 82478 (P) transgenic embryos after specific signaling pathway blockade. The total number of embryos counted in three independent experiments is represented.