
|
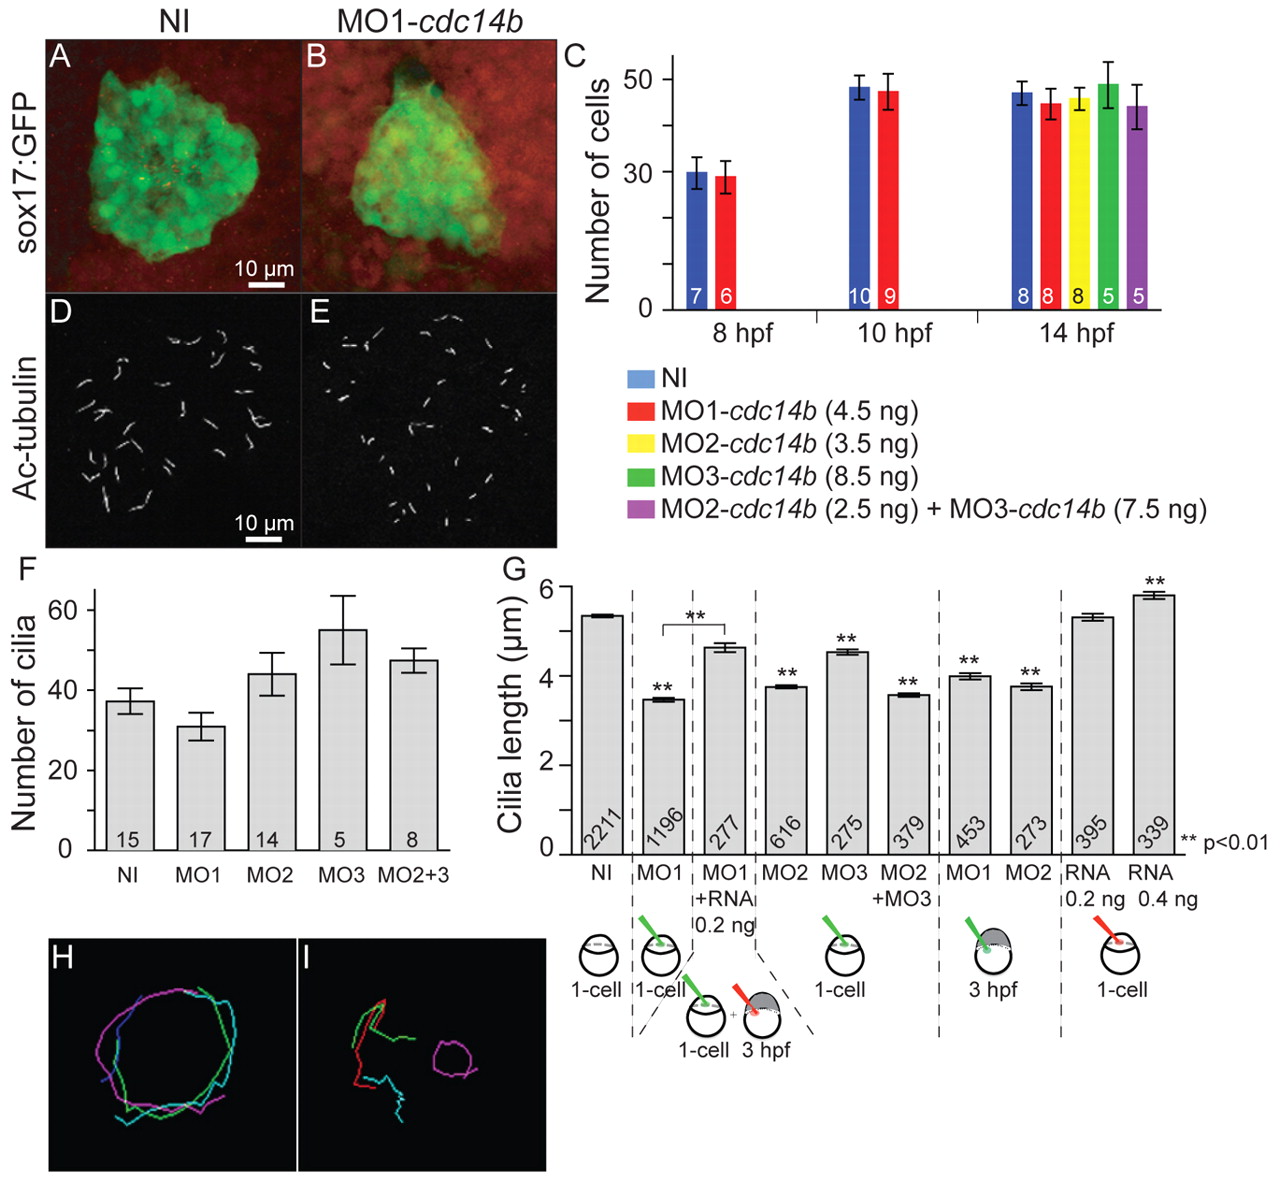
Fig. 3 Cdc14B loss- and gain-of-function effect on the KV. (A,B) KV at 10 hpf visualized using Sox17-GFP. (C) The number of cells in the KV was determined in non-injected and cdc14b MO-injected zebrafish embryos at the indicated times. (D,E) Cilia in the KV at 14 hpf visualized with an anti-acetylated-tubulin (Ac-tubulin) antibody. (F,G) Cilia numbers (F) and cilia length (G) were determined at 14 hpf. The numbers of embryos (C,F) and cilia (G) analyzed are indicated. Data are mean ± s.e.m. Statistics were carried out using Student′s t-test. Unless otherwise shown, statistics were calculated against the NI sample. (H,I) Particle paths in the KV of a single non-injected (H) or MO1-cdc14b-injected (I) embryo at 14 hpf. Three embryos were analyzed per condition.