
|
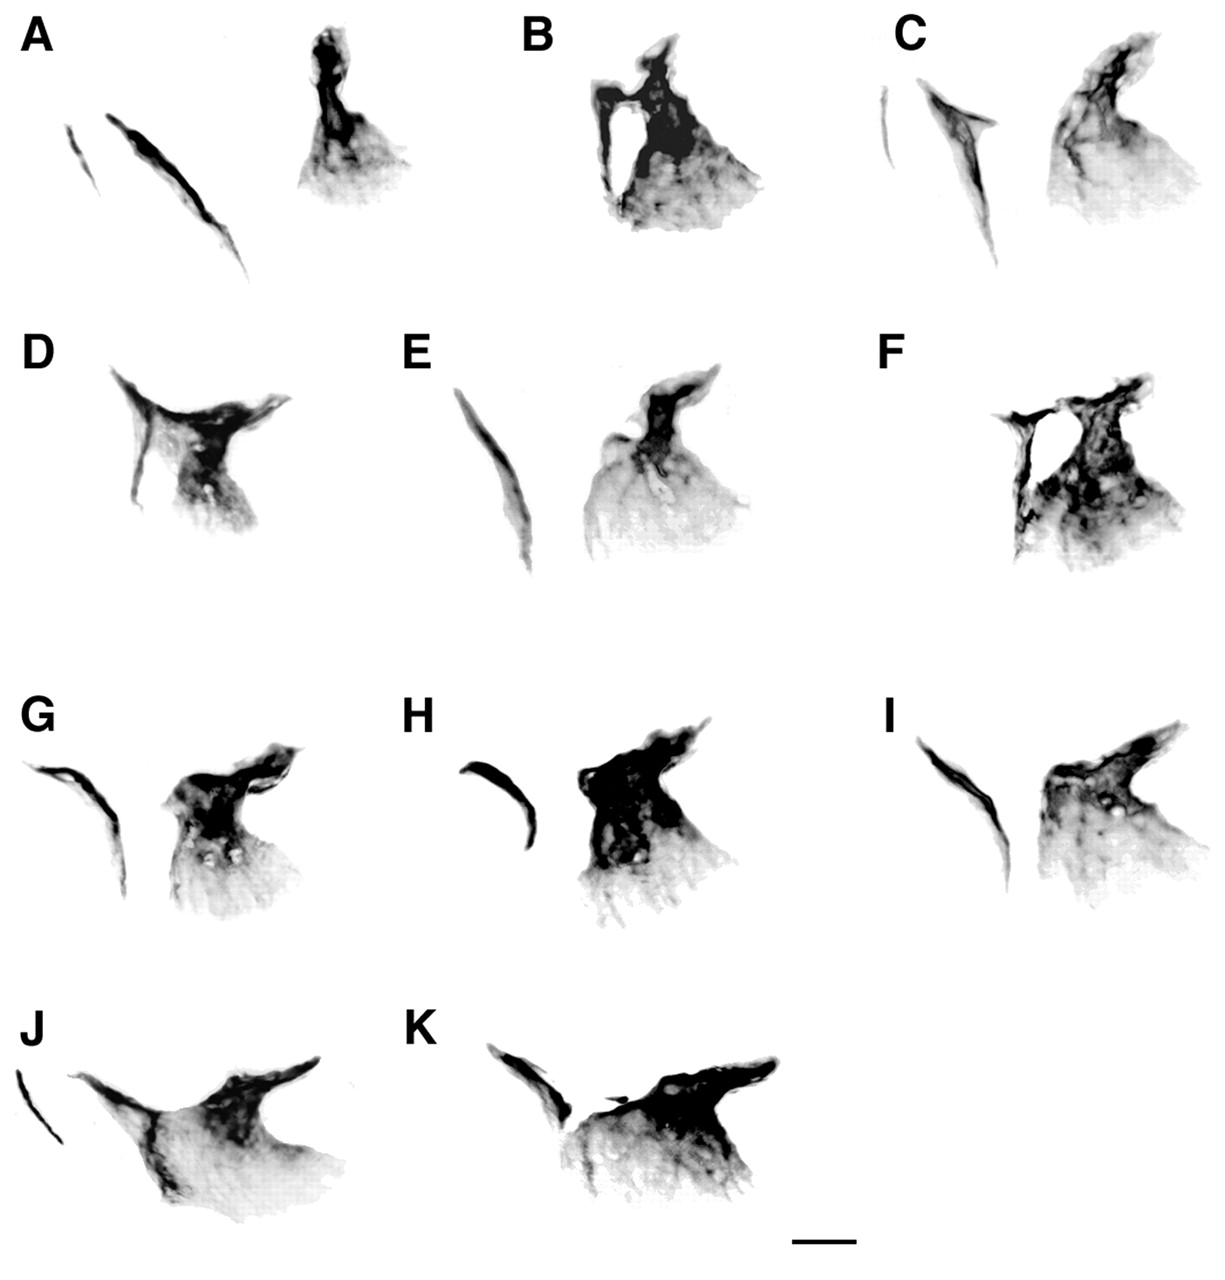
Fig. 8 Phenotypic series of opercle-gain and branchiostegal phenotypes in larvae with mild reductions of Edn1. Left-side views (confocal projections, Calcein labeling) with dorsal to the top at 6 or 7 days postfertilization. (A) Wild type (WT). (B-K) Mutants and MO-injected larvae arranged according to the extent of the increase in size of the opercle. (B,F) she mutants. (C) edn1-MO injected at 5 ng. (E,H,I,K) edn1-MO injected at 1.5 ng. (D,G,J) stu mutants. Two branchiostegal rays are present in (A) and (C), and apparently also in (J), in which the larger dorsal one is deformed and fused with the opercle by a thin but continuous sheet of bone. We interpret (K) as a similar prominent fusion between the disrupted branchiostegal ray and the opercle. (B,D,F) Examples of `walking stick′ phenotypes, showing fusions at the joint regions of the bones. (C) The branchiostegal ray is deformed with a spur appearing to correspond to an expanded joint region, also present in the walking stick examples. The fusions seem to occur all along the series (i.e. in examples with either a mild or severe opercle gain), whereas the curvature of the branchiostegal ray roughly increases along the series with the most extreme case in H. Scale bar: 50 μm.