
|
Fig. S2 Related to Figure 3.
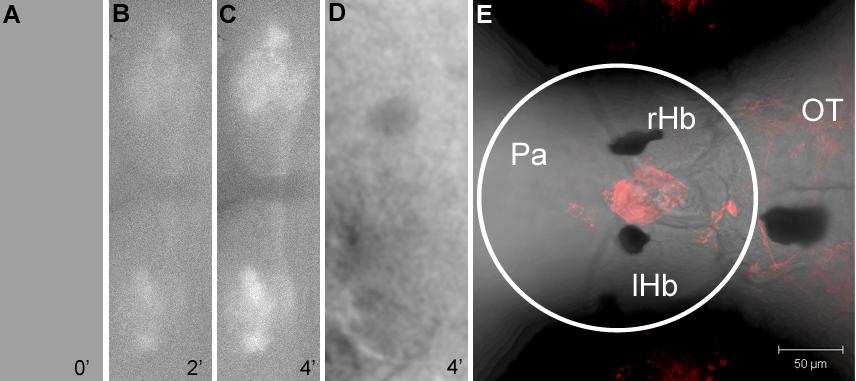
(A-C) Dorsal view of the habenula of a KR11 fish, irradiated after injection of FITC-annexin V into the forebrain. The images show relative change in FITC fluorescence intensity (F/F0) following irradiation with green light.
(A) Prior to irradiation.
(B) After 2 minutes of irradiation.
(C) After 4 minutes of irradiation.
(D) The habenula of a nontransgenic fish that had been injected with FITC-annexin V, then irradiated for 4 minutes. There is no signal in habenula afferents. Image processing in panels A-D was carried out using the “F div F0” plugin in imageJ. A Gaussian filter (sigma = 2.0) was used after normalization.
(E) Dorsal view of a KR4 transgenic fish. Cells in the circumventricular organ, anterior to the habenula, as well as the parapineal organ, express KillerRed. The region bounded by the white circle was irradiated. A similar region was irradiated in KR11 fish used in behavioral experiments.
Pa: pallium; OT: optic tectum; rHb: right habenula; lHb: left habenula. Anterior is to the left.