
|
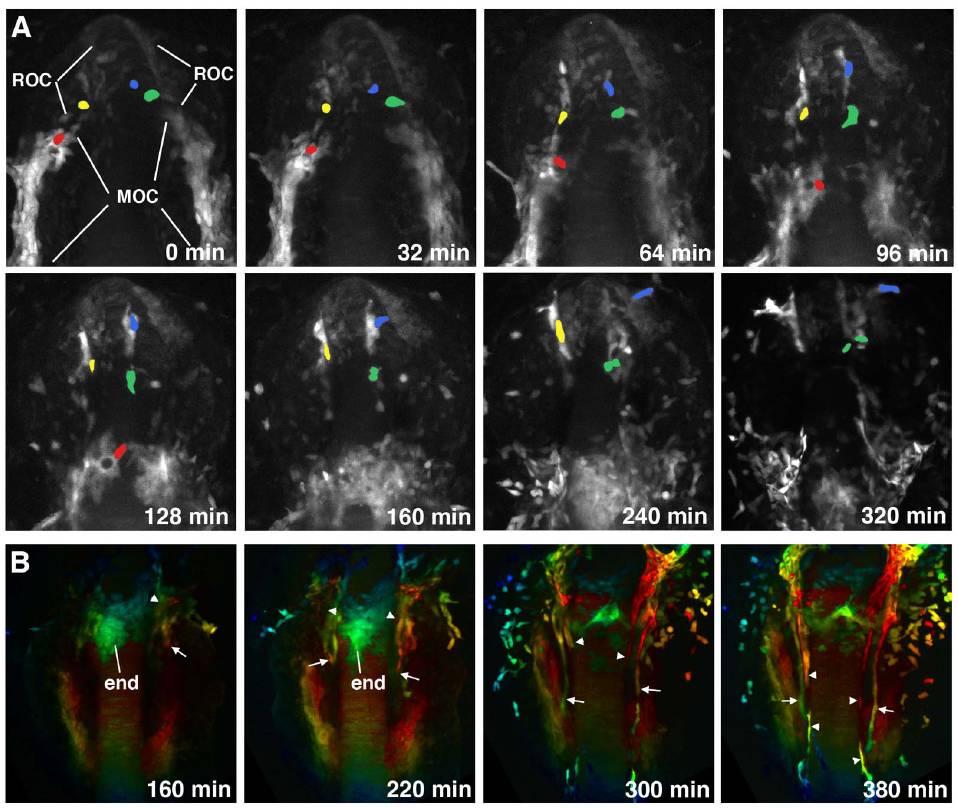
Fig. S3 Individual cell migration and extension of lda and phbc in etsrp:GFP line. (A) Migration of ROC and MOC progenitors during the 10-16-somite stages. Dorso-anterior view of the head region, anterior is up. Selected cells were manually traced using time-lapse imaging data and labeled with different colors. It was not possible to follow every cell though all the stages. Note that ROC progenitors actively migrate as individual cells and eventually adhere to their neighbors, forming one of ROC-derived vessels. Bilateral stripes of MOC progenitors converge towards the midline as the embryo undergoes convergent extension. The rostral MOC progenitors, including the cell marked in red migrate as a group posteriorly and towards the midline, many of them contributing to the pool of endocardial progenitors. (B) Anterior portions of the arterial lda (arrows) and venous phbc (arrowheads) originate in the MOC region at the 14-18 somite stages. Depth-coded dorsal view of etsrp:GFP embryo, anterior is up. Blue colors mark deeper cells, while red colors mark closer cells. Time scale begins at the start point of imaging (10-somite stage, Movie 12). Arrowhead and arrows in 160 and 220 min panels point to the areas where lda and phbc originate before angiogenic extensions become apparent. A posterior portion of lda that originates from the dorsal aorta can be seen in the 380 min panel (lower arrowhead). end, endocardial precursors.
Reprinted from Developmental Biology, 348(1), Proulx, K., Lu, A., and Sumanas, S., Cranial vasculature in zebrafish forms by angioblast cluster-derived angiogenesis, 34-46, Copyright (2010) with permission from Elsevier. Full text @ Dev. Biol.