
|
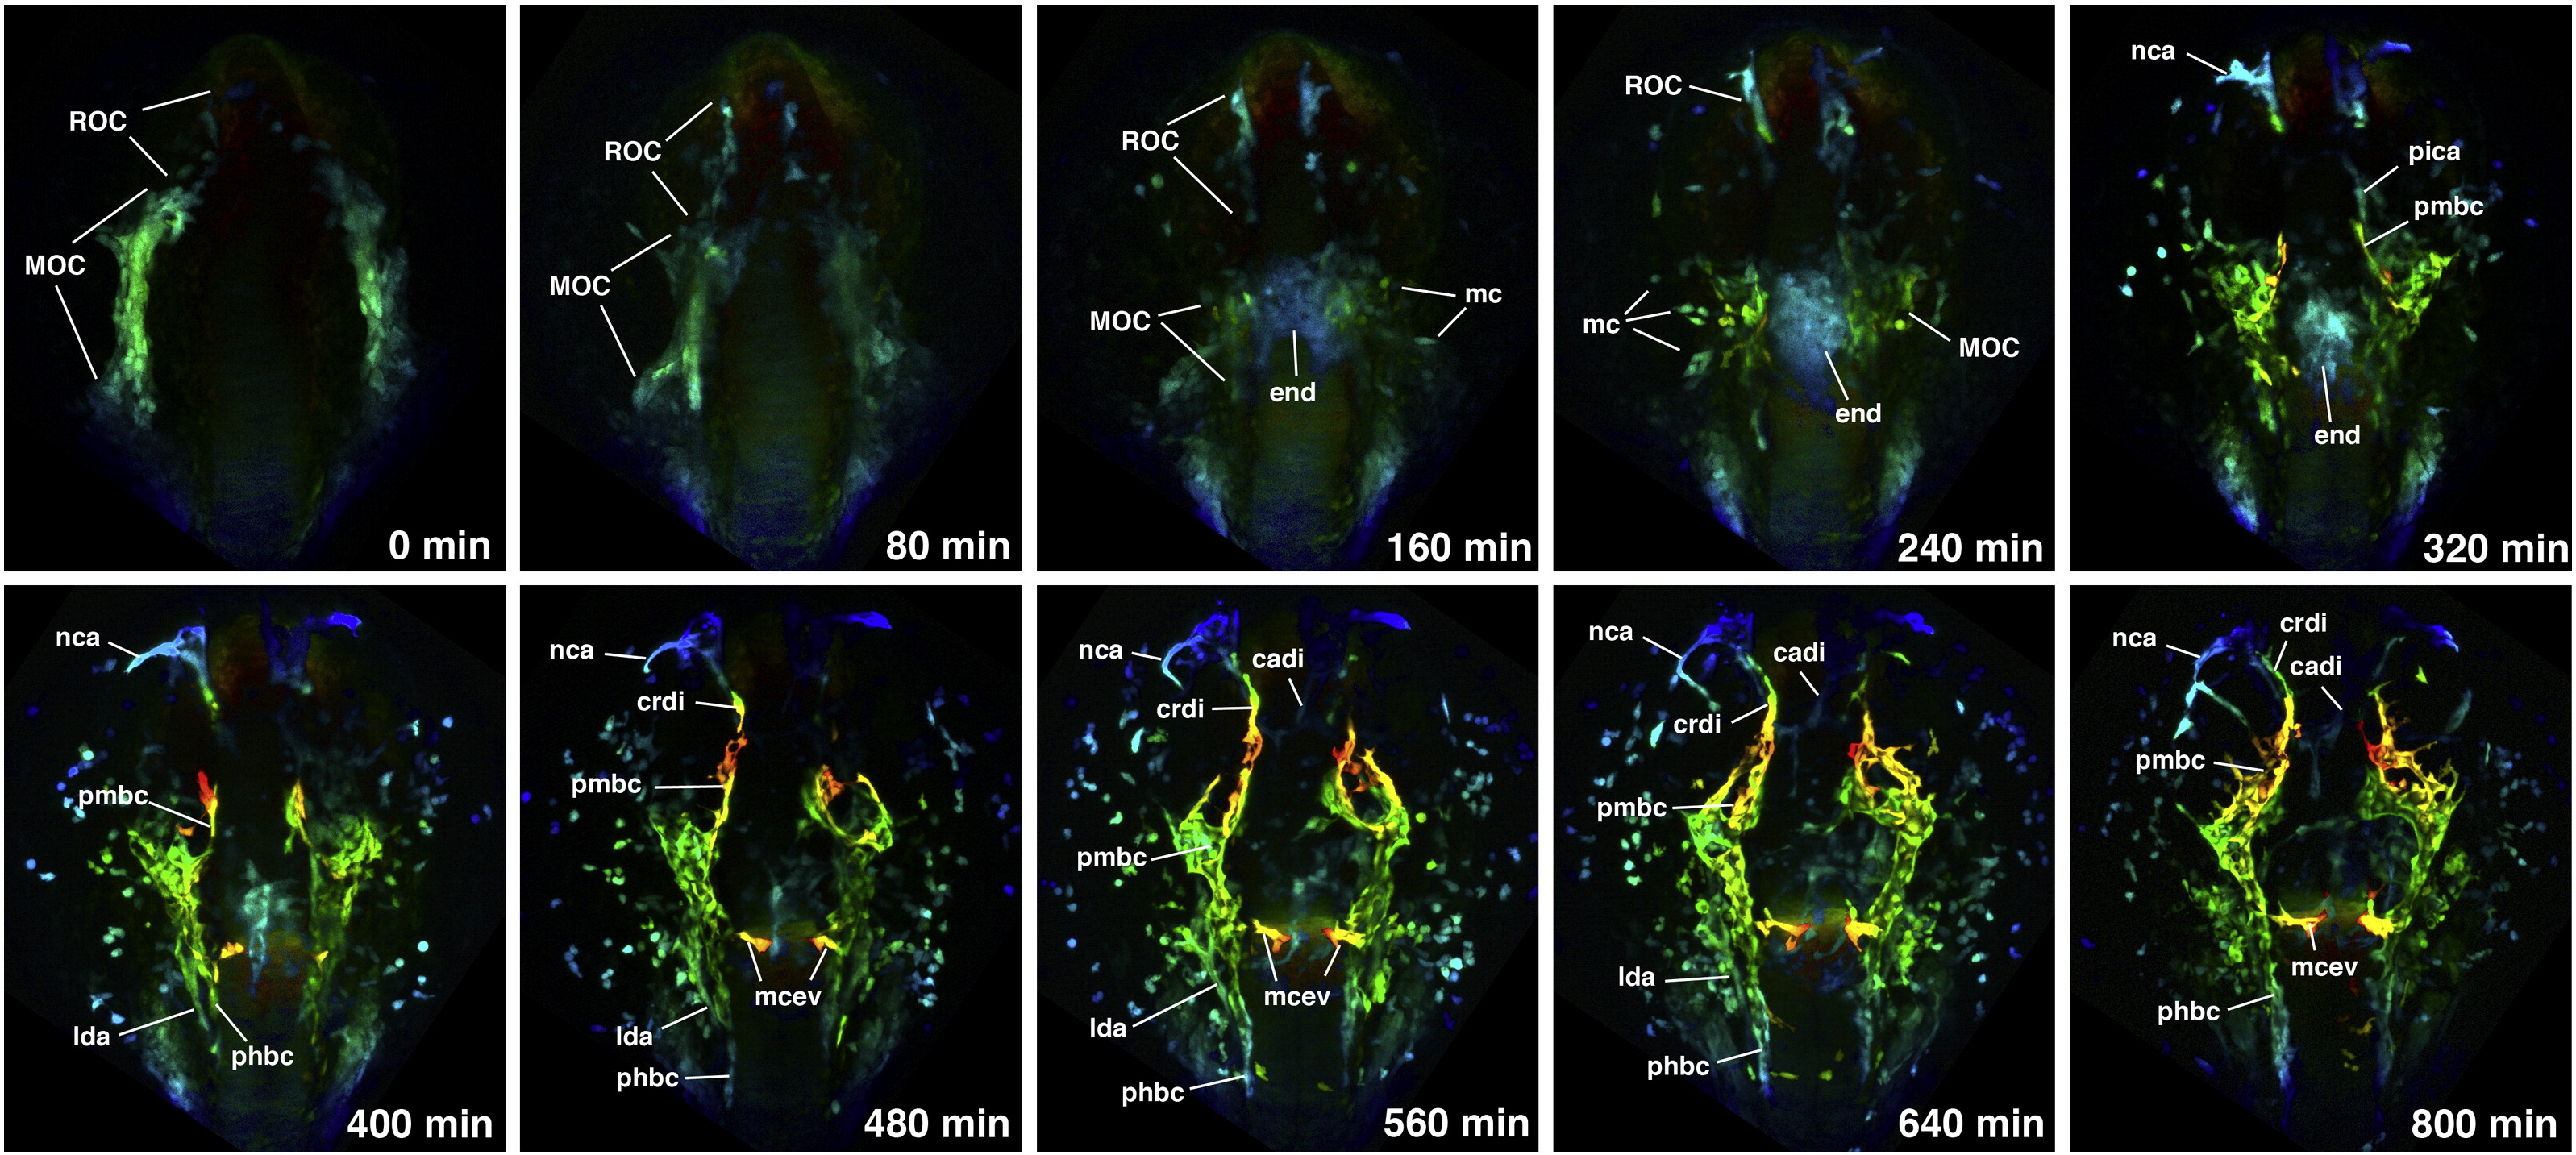
Fig. 5 Depth-coded time-lapse images of cranial vessel formation in etsrp:GFP transgenic line from the 10-somite to approximately 22 hpf stages. Blue colors corresponded to the deepest cells while red colors mark the closest ones. Dorso-anterior view of the head region, anterior is to the top. 0–240 min. Endothelial cells separate into two populations. The most rostral cells migrate individually and coalesce into the rostral organizing center (ROC) while more posteriorly located cells coalesce into the midbrain organizing center (MOC). A subpopulation of MOC cells which include endocardial (end) and myeloid precursors migrate deep inside towards the midline. Multiple myeloid cell (mc) precursors migrate out of the MOC. 320–800 min. Angiogenic extensions originate in the ROC and the MOC. Crdi extends dorsally and posteriorly from the ROC and joins with pmbc which extends anteriorly from the MOC. lda and phbc migrate posteriorly from the MOC. Individual endothelial cells migrate ventrally to form cadi. Nca branches from the ROC but does not form connections until later stages.
Reprinted from Developmental Biology, 348(1), Proulx, K., Lu, A., and Sumanas, S., Cranial vasculature in zebrafish forms by angioblast cluster-derived angiogenesis, 34-46, Copyright (2010) with permission from Elsevier. Full text @ Dev. Biol.