
|
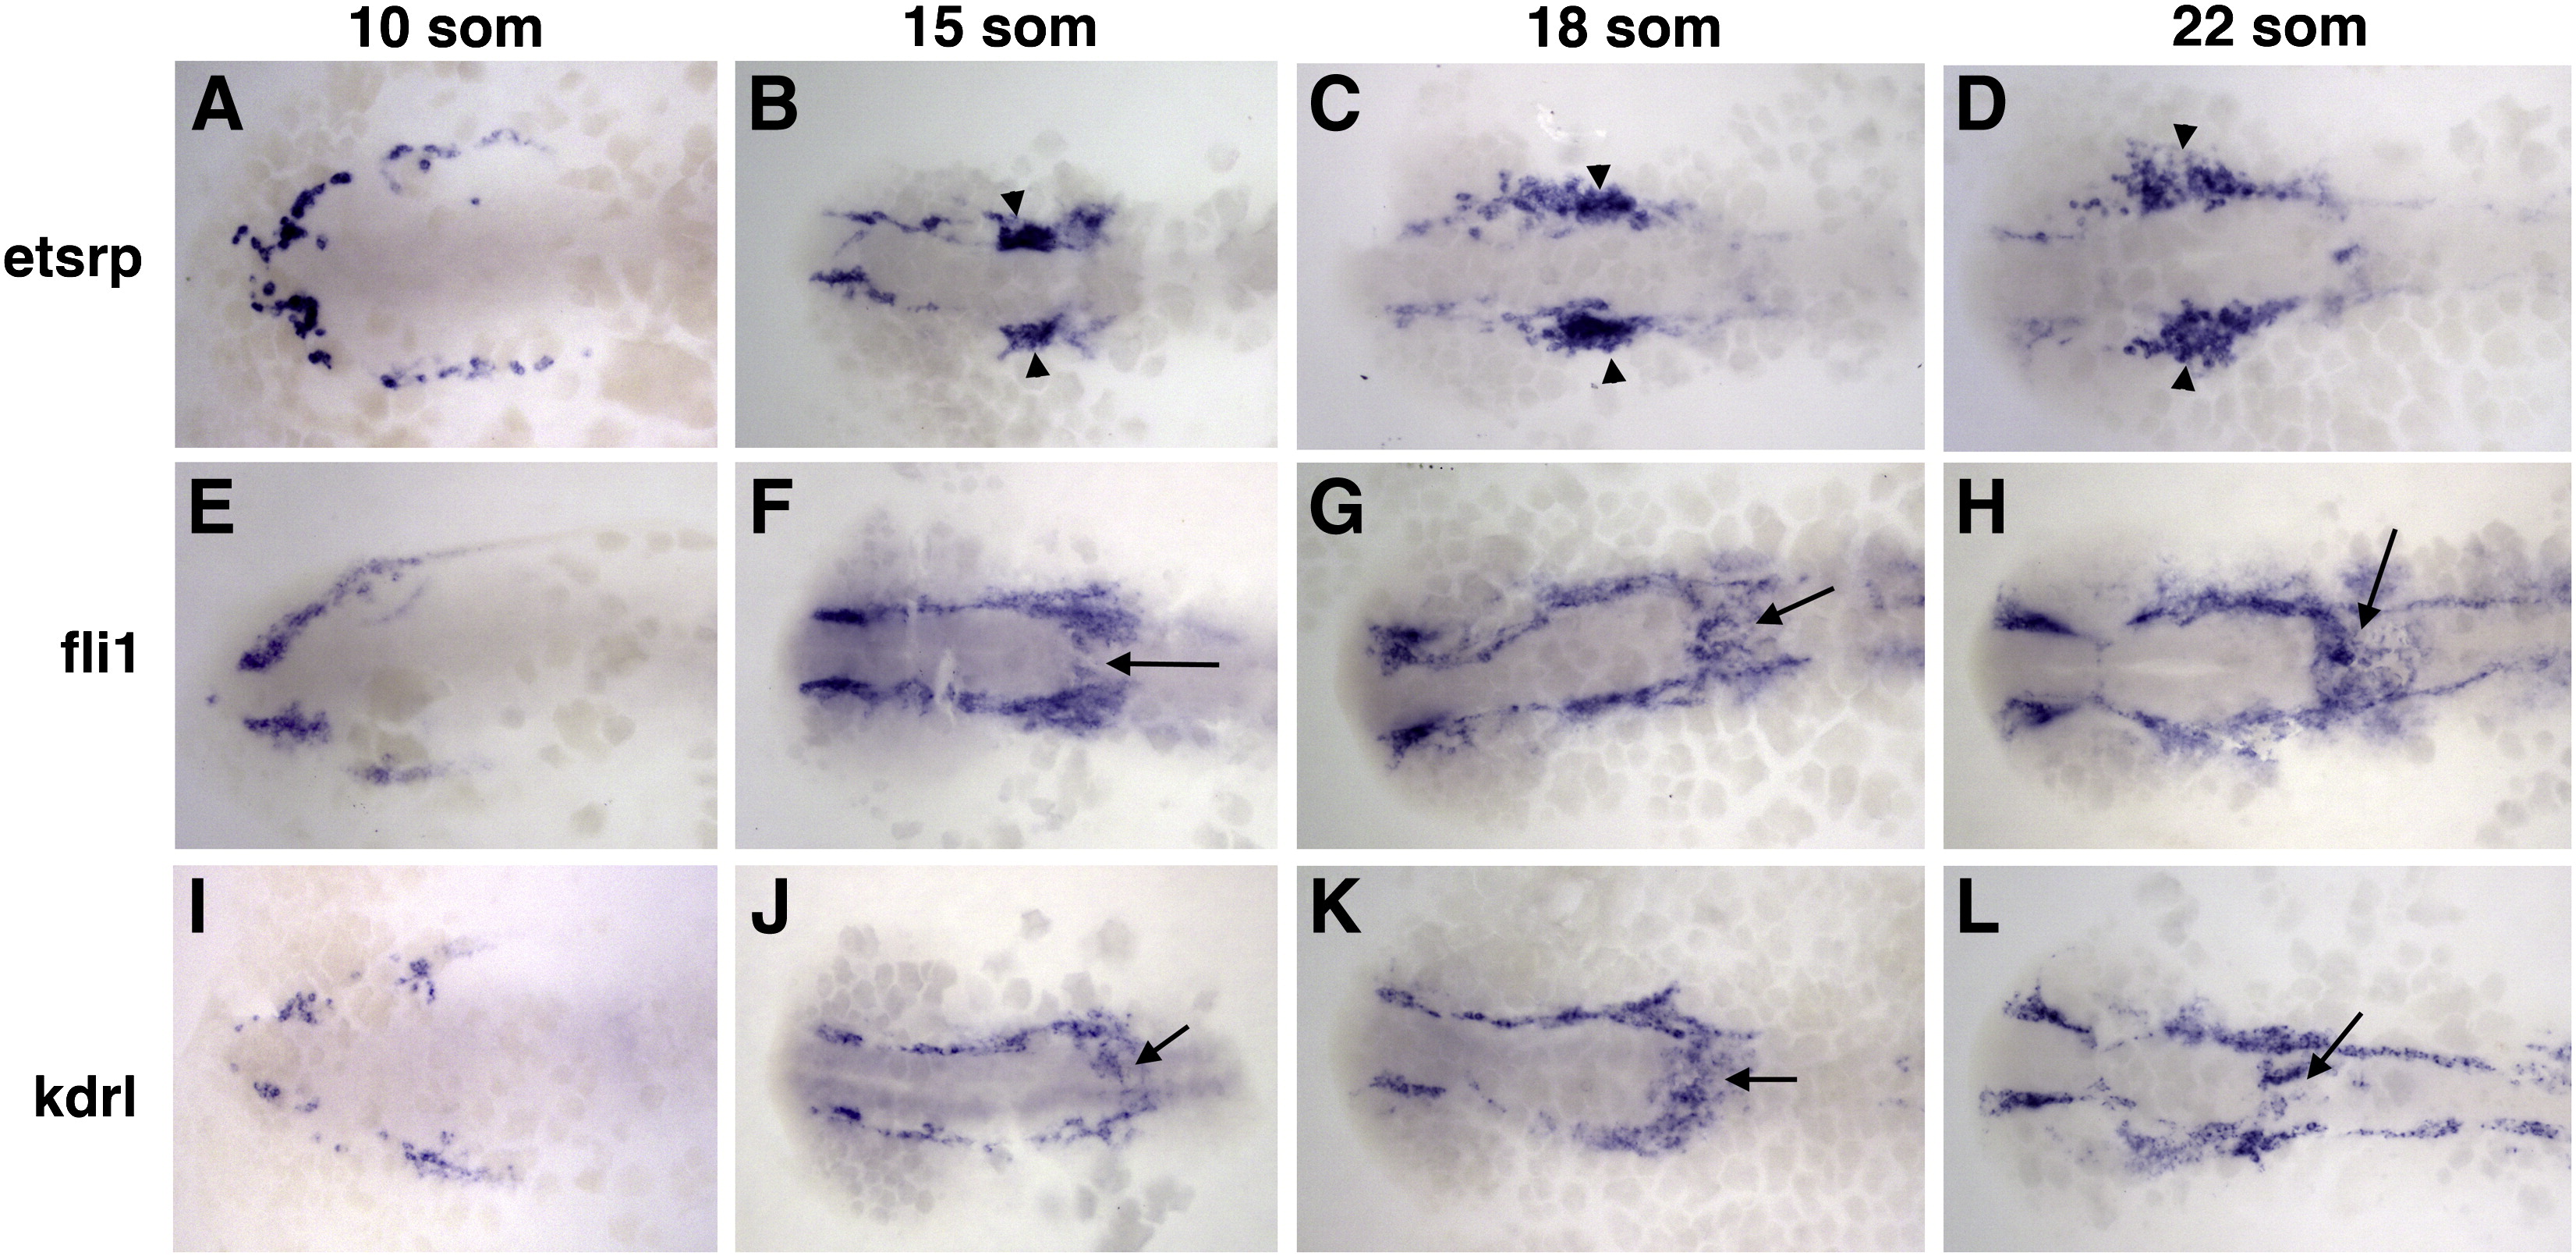
Fig. 3 Comparison of etsrp, fli1 and kdrl expression in ALPM at the 10-somite (A,E,I), 15-somite (B,F,J), 18-somite (C,G,K) and 22-somite (D,H,L) stages. Dorsal view of the anterior region of flat-mounted embryos, anterior is to the left. (A–D) etsrp, (E–H) fli1, and (I–L) kdrl expression. While all three genes are expressed in endothelial cell precursors, they exhibit the following differences. Intense etsrp expression is present within the MOC (arrowheads, B–D) in the myeloid and, possibly, endothelial progenitors. Note that etsrp is not expressed in myeloid progenitors once they leave the MOC. Both fli1 and kdrl but not etsrp exhibit expression in the endocardial precursors (arrow, F–H,J–L).
Reprinted from Developmental Biology, 348(1), Proulx, K., Lu, A., and Sumanas, S., Cranial vasculature in zebrafish forms by angioblast cluster-derived angiogenesis, 34-46, Copyright (2010) with permission from Elsevier. Full text @ Dev. Biol.