
|
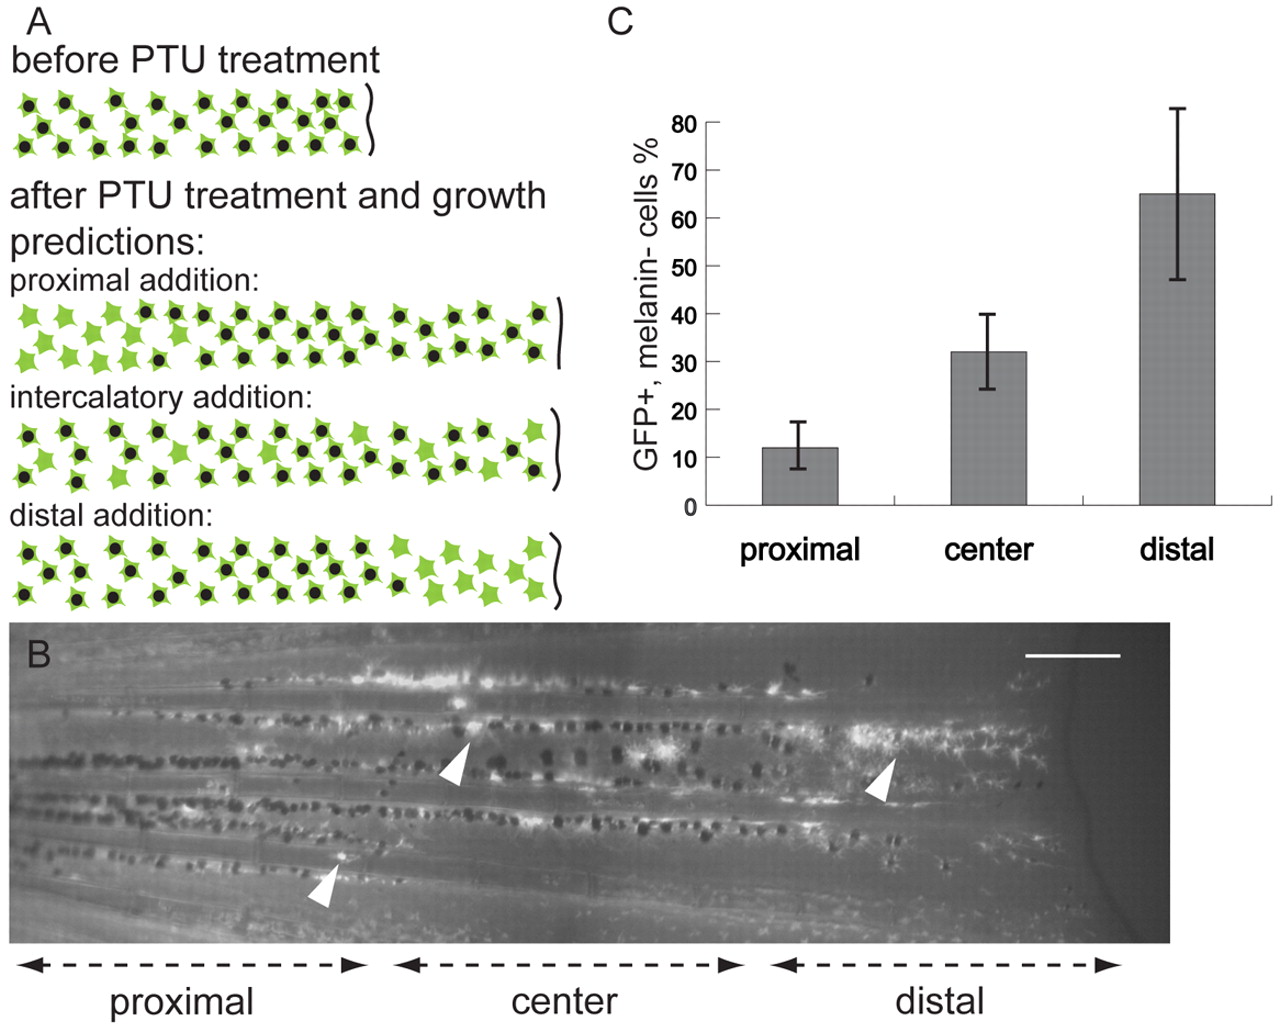
Fig. 3 Newly formed melanocytes arise primarily at the distal edge of the fin. (A) Predictions of different models for site of melanocyte growth revealed by melanocyte time-of-differentiation assay (Hultman and Johnson, 2010). This method combines PTU treatment (to suppress melanin synthesis in newly differentiated melanocytes) with the Tg(fTyrp>GFP)j900 transgenic marker to reveal newly differentiating melanocytes. Solid green stars represent newly developed melanin- GFP+ melanocytes. Green stars with black centers represent older melanin+ GFP+ melanocytes. (B) Fluorescence image of central melanocyte stripe in caudal fin of Tg(fTyrp>GFP)j900 transgenic fish following growth for 2 weeks in the presence of PTU. White arrowheads indicate the melanin- GFP+ newly differentiated melanocytes. Near the distal end, almost all melanocytes are melanin- GFP+. Scale bar: 0.2 mm. (C) Quantitative analysis showing percentage of new melanocytes in each of the proximal, center and distal regions of the growing center stripe. Error bars indicate standard deviation.