
|
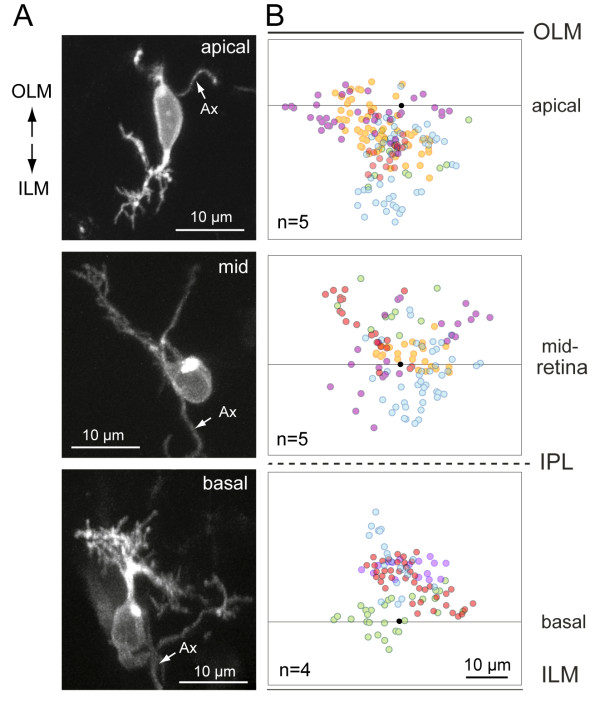
Fig. 6 Distribution of dendritic tips in mislocalized retinal ganglion cells in the has retina. RGCs were labeled either by transient expression of isl2b:MXFP in has animals or visualized in brn3c:MGFP; has animals. Ax, axon. (A) Examples of isolated RGCs at various depths of the has retina. The cell was oriented in three dimensions as described in the Materials and methods. (B) Summary of the distributions of dendritic tips for several RGCs at the various depths. Black dots represent the center of the soma; the line through the dot is approximately parallel to the ILM or OLM. Each color represents a separate RGC. Red dots are tips from the cells shown in the left column.