
|
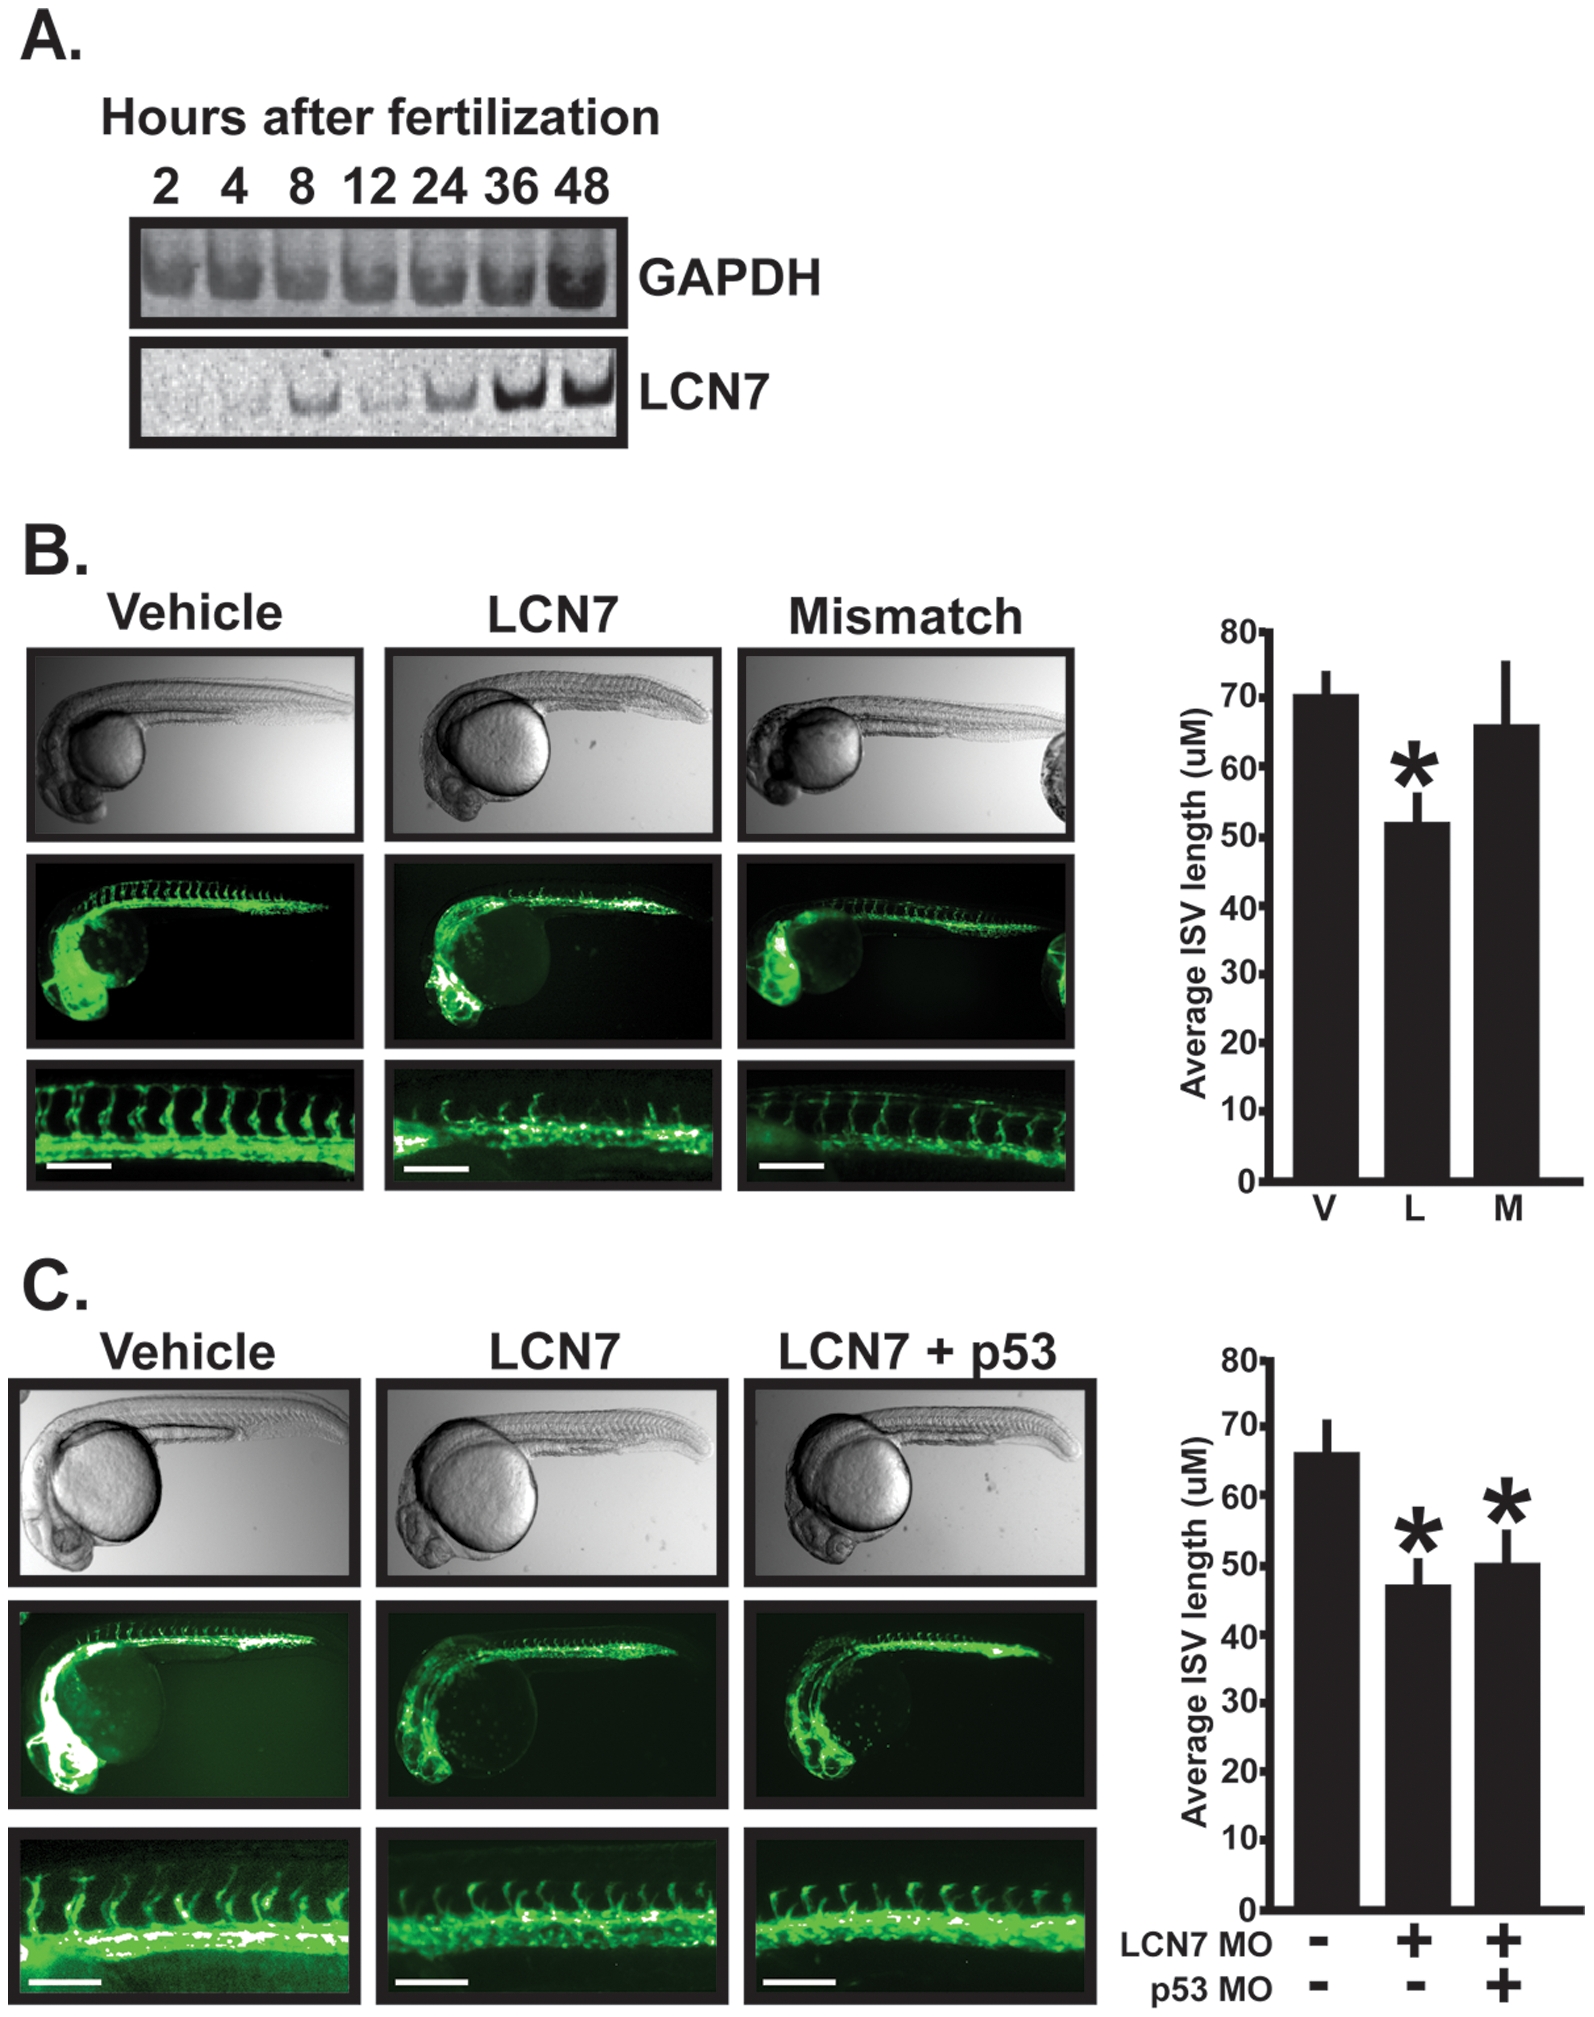
Fig. 6 Morpholino knockdown in zebrafish embryos.
A. LCN7 expression was detected in developing zebrafish embryos by RT-PCR analysis. cDNAs pools were generated from embryos ranging from 2 to 48 hours and subjected to RT-PCR analysis with either LCN7 or GAPDH specific oligonucleotides. B. Freshly fertilized zebrafish embryos between 1 to 8 cells were injected with morpholino vehicle (water +.1% phenol red) or equal volumes containing either 1 ng of LCN7 morpholino, or 1 ng of mismatched LCN7 control morpholino. Microangiogram analysis was performed approximately 28 hours later by detecting endothelial-specific expression of GFP. The accompanying graph depicts average ISV pixel length (converted to μM) as measured along the entire dorsal surface in each of five embryos in each experiment. Results shown are the average +/- SE of five independent experiments. Bar equals 100 μM. C. Freshly fertilized zebrafish embryos were injected with morpholino vehicle (water +.1% phenol red) or equal volumes containing 1 ng of LCN7 morpholinos or 1 ng of LCN7+1.5 ng of p53 morpholinos. ISV vessel length was measured as described above and results are presented as the average +/- SE of five independent experiments consisting of at least five individual fish per injection. For all panels, * indicates p<.05, students t-test. Bar equals 100 μM.