
|
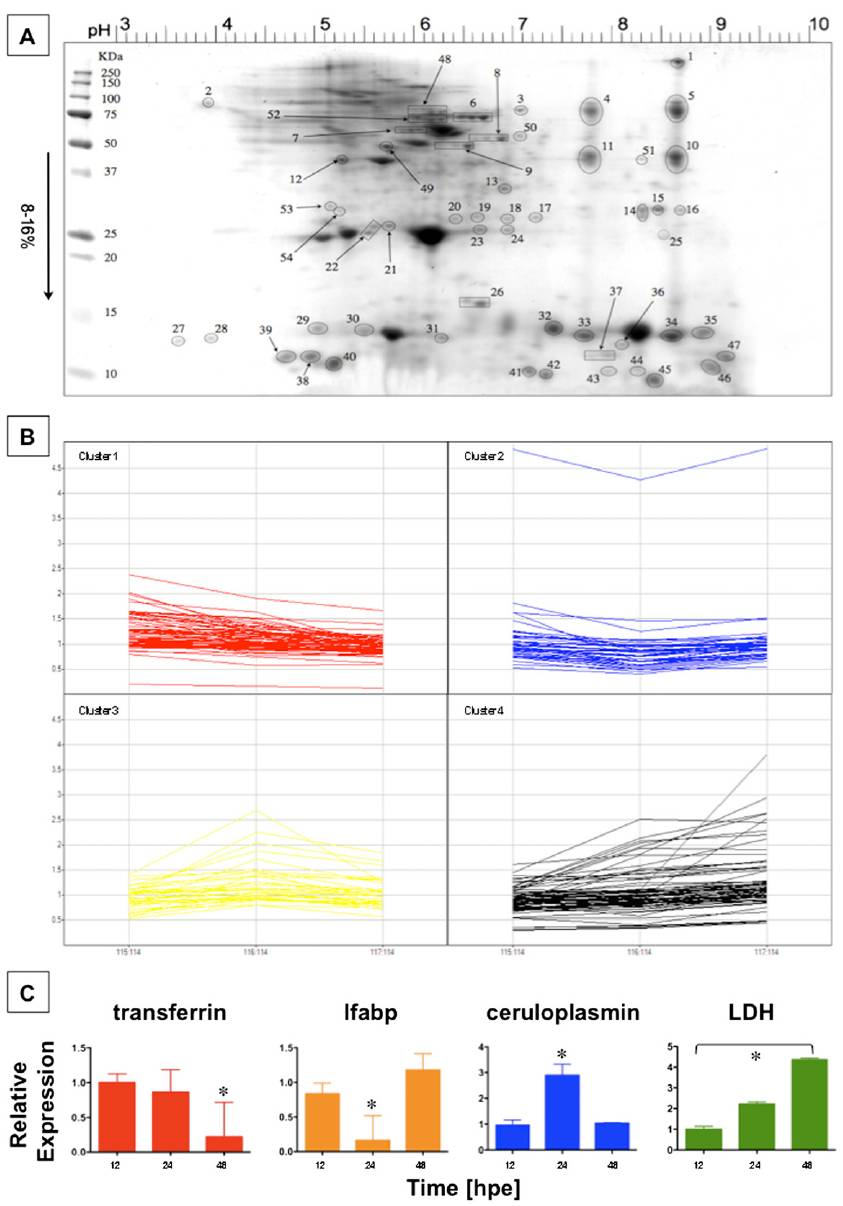
Fig. S3 Effect of APAP treatment on serum protein concentration by iTRAQ analysis. (A) Zebrafish serum was collected at 12, 24, and 48 h post-APAP (5 mM) exposure. SDS page revealed 54 spots excised manually from the Coomassie stained gel that were subjected to iTRAQ analysis. (B) The individual relative protein-concentration changes over time are depicted for all four clusters identified. (C) Quantitative PCR (qPCR) was performed for genes representing each cluster on dissected liver samples at 12, 24, and 48 hpe (ANOVA, n = 4). transferrin expression declined over the entire time course. *Significant vs. 12 and 24 hpe, P < 0.05. lfabp and ceruloplasmin expression changed in a biphasic manner. *Significant vs. 12 and 48 hpe, P < 0.01. Lactate dehydrogenase (LDH) expression increased over time. *All time points significant, P < 0.001.