
|
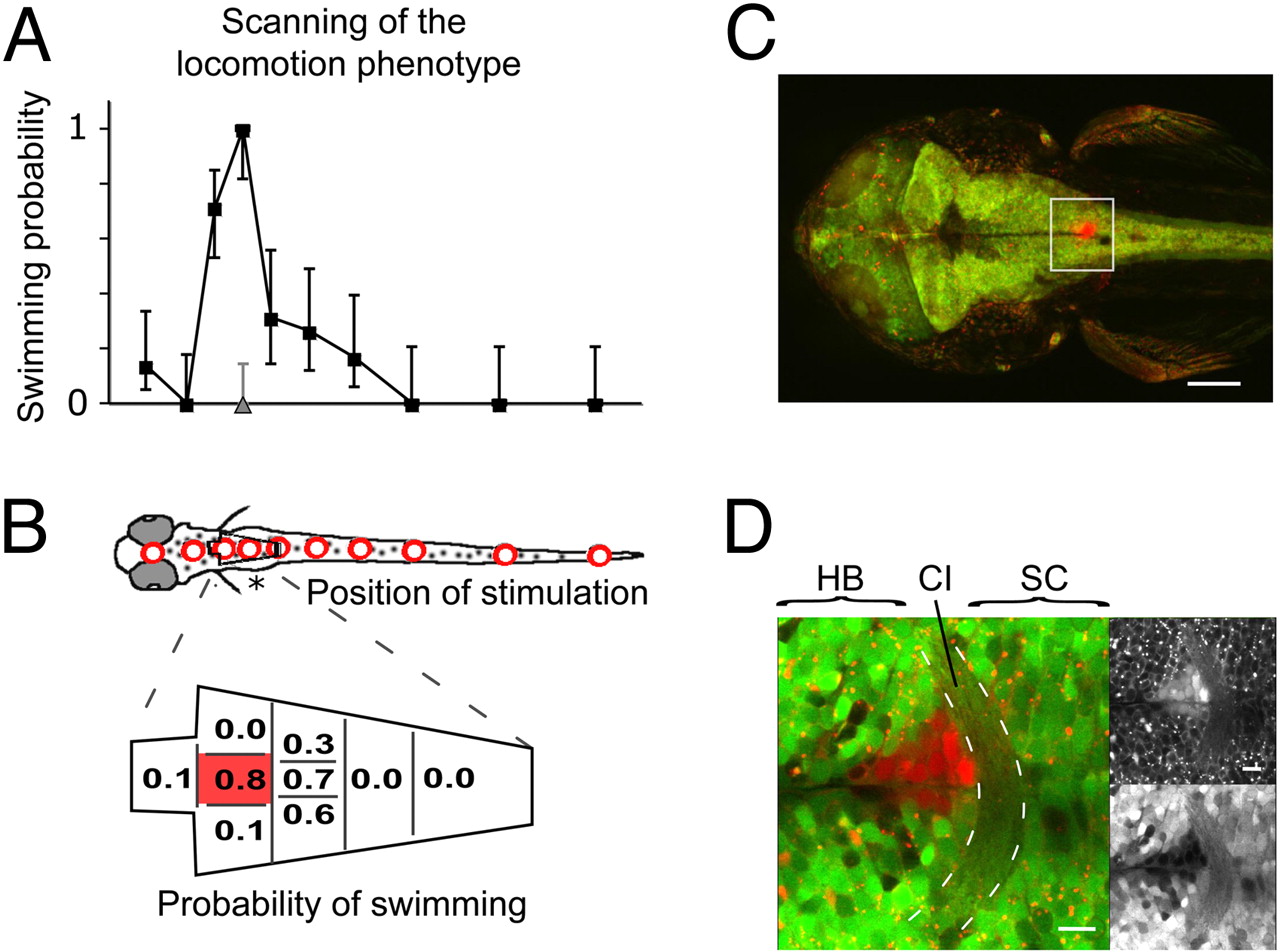
Fig. 4
Mapping of the locomotion phenotype that was induced by rebound from NpHR silencing (A) The probability of observing a forward swim is plotted versus the position of stimulation (200-μm optic fiber) in 3 dpf zebrafish. Mean probabilities of NpHR-mCherry expressors (black) and siblings (gray, only third position) are shown with 95% confidence intervals (Wilson score interval for binomial distributions). (B) The hindbrain region in (A) (asterisk) was mapped in detail with a 50-μm fiber. The probability was maximal in a small area along the midline just caudal to the pectoral fins. A total of 295 trials was analyzed in (A) and (B) (n = 7 animals). (C) The phenotype was mapped in an animal transgenic for Gal4s1101t; UAS:NpHR-mCherry; UAS:Kaede. The region where the animal responded reliably was illuminated with UV light to photo-convert Kaede. (D) Close-up of the box in (C). A narrow column of tissue was converted, labeling only a few cells in every optical section. The maximal response probability was found in the region of the commissura infima Halleri (CI, dashed lines), which demarcates the border between spinal cord (SC) and hindbrain (HB). The upper right shows the red channel and the lower right the green channel. [Scale bars, 100 μm in (C) and 10 μm in (D).]