
Fig. S1
- ID
- ZDB-IMAGE-101122-27
- Publication
- Zhang et al., 2010 - Highly aneuploid zebrafish malignant peripheral nerve sheath tumors have genetic alterations similar to human cancers
- All Figures
- Figures for Zhang et al., 2010
|
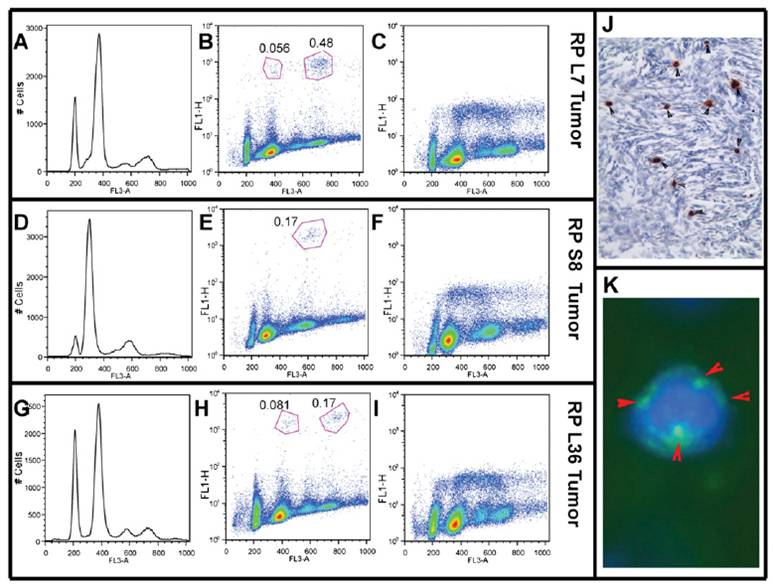
Fig. S1 Cell-cycle properties of zebrafish malignant peripheral nerve sheath tumor (MPNST) cells. Results are shown for cells from three different MPNSTs from different rp heterozygotes: rpL7 (A–C), rpS8 (D–F), and rpL36 (G–I). (A, D, and G) DNA content distribution by FACS analysis of propidium iodide (PI)- labeled cells. On the x axis, 200 represents the normal 2N position, which was calibrated by running a mixture of normal and tumor cells. (B, E, and H) FACS analysis of cells double-stained with PI (x axis) and antibody to pH3 (y axis). The mitotic cells are pH3-positive, and are circled in red. The percentages of the cell populations are indicated beside the circles. (C, F, and I) S-phase labeling with a 30-min BrdU pulse. The positions of major horseshoe shapes indicate that the majority of proliferating cells are aneuploid. (J) Histological sections from the rpL35 tumor were stained with antibodies to pH3. Mitotically active tumor cells were stained brown. (K) Tumor cells from rpL35 were double-stained with DAPI and anti-γ-tubulin. The multiple centrosomes are indicated by red arrowheads.