
|
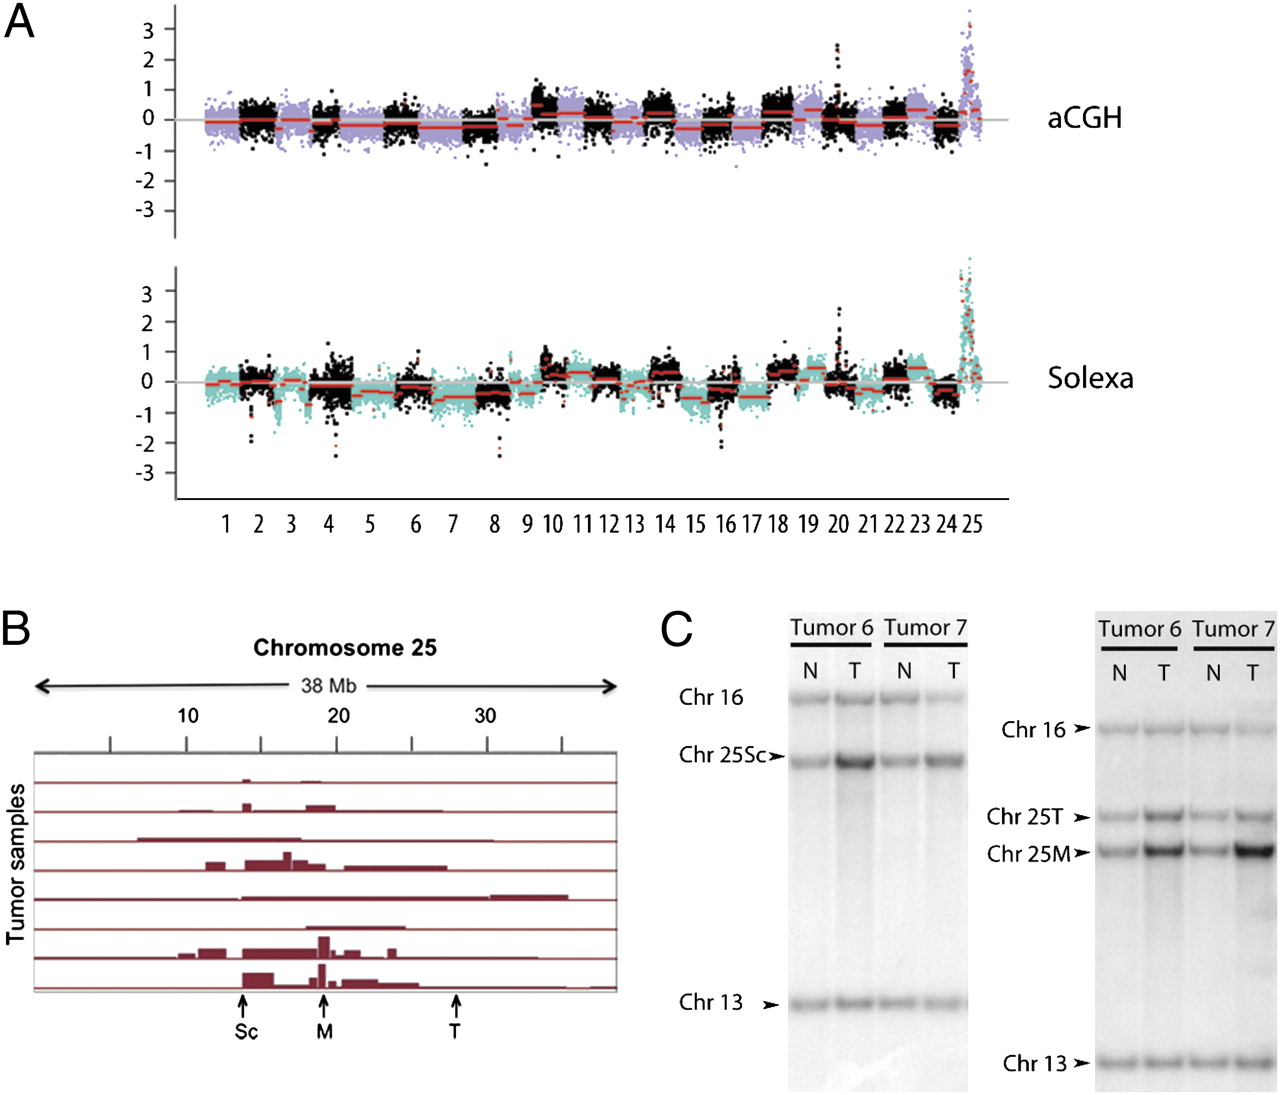
Fig. 3 Array CGH results are supported by Illumina sequencing and Southern blot. (A) Postnormalization data of one zebrafish tumor/normal sample pair analyzed by aCGH (Upper) and Illumina sequencing (Lower). The red line indicates the segment mean as obtained by a circular binary segmentation algorithm. Note that the results obtained by these two technologies with respect to both inter- and intrachromosomal changes are largely in agreement. (B) Array CGH analysis demonstrated that 8 of the 36 tumor samples showed subchromosomal amplifications on chromosome 25 beyond the chromosome-level gain. The positions of Southern blot probes to two areas most often overamplified (Sc and M) and an area not additionally amplified (T) are indicated by arrows. (C) Southern blots of the DNA isolated from tails (N) and tumors (T) from 2 of the 14 rp heterozygotes analyzed in this way. Three or four probes were used on each blot; the positions of bands to which probes from chromosomes 13 or 16 or various locations on chromosome 25 as indicated in B hybridized are marked. Note that in tumor 6, all of the chromosome 25 probes show more signal in the tumor sample than the tail sample; in tumor 7, whereas all chromosome 25 probes do so, the increase for the M probe (and to a lesser extent the Sc probe) is greater than that for the T probe. Quantitation for all of the 14 rp heterozygotes and various probes can be found in Figs. S2 and S3.