
Image
|
Figure Caption
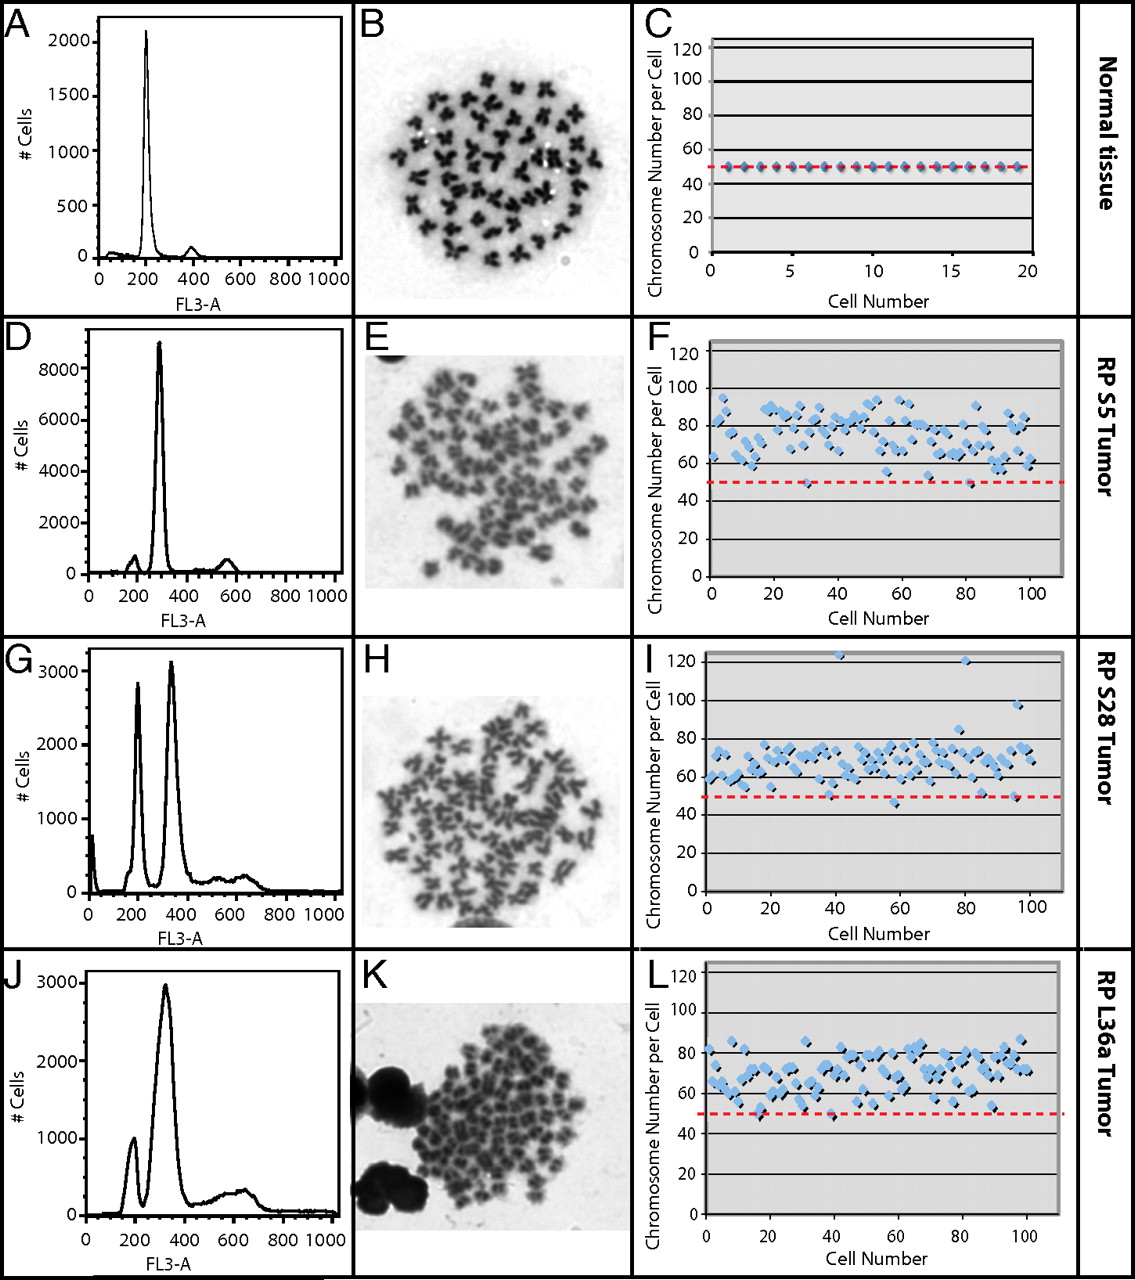
Fig. 1
Zebrafish MPNSTs are highly aneuploid and heterogeneous. FACS DNA content analysis (A, D, G, and J), metaphase chromosome spreads (B, E, H, and K), and number of chromosomes per cell in 19 normal cells (C) or 100 tumor cells (F, I, and L) from three MPNSTs arising in rp heterozygous fish or from normal tissue, as labeled on the right. Tumors possess an aneuploid peak and usually in addition a 2N peak that is located at around 200 on the x axis. Note that the number of chromosomes per cells varies dramatically within a single tumor.
Acknowledgments
This image is the copyrighted work of the attributed author or publisher, and
ZFIN has permission only to display this image to its users.
Additional permissions should be obtained from the applicable author or publisher of the image.
Full text @ Proc. Natl. Acad. Sci. USA