
|
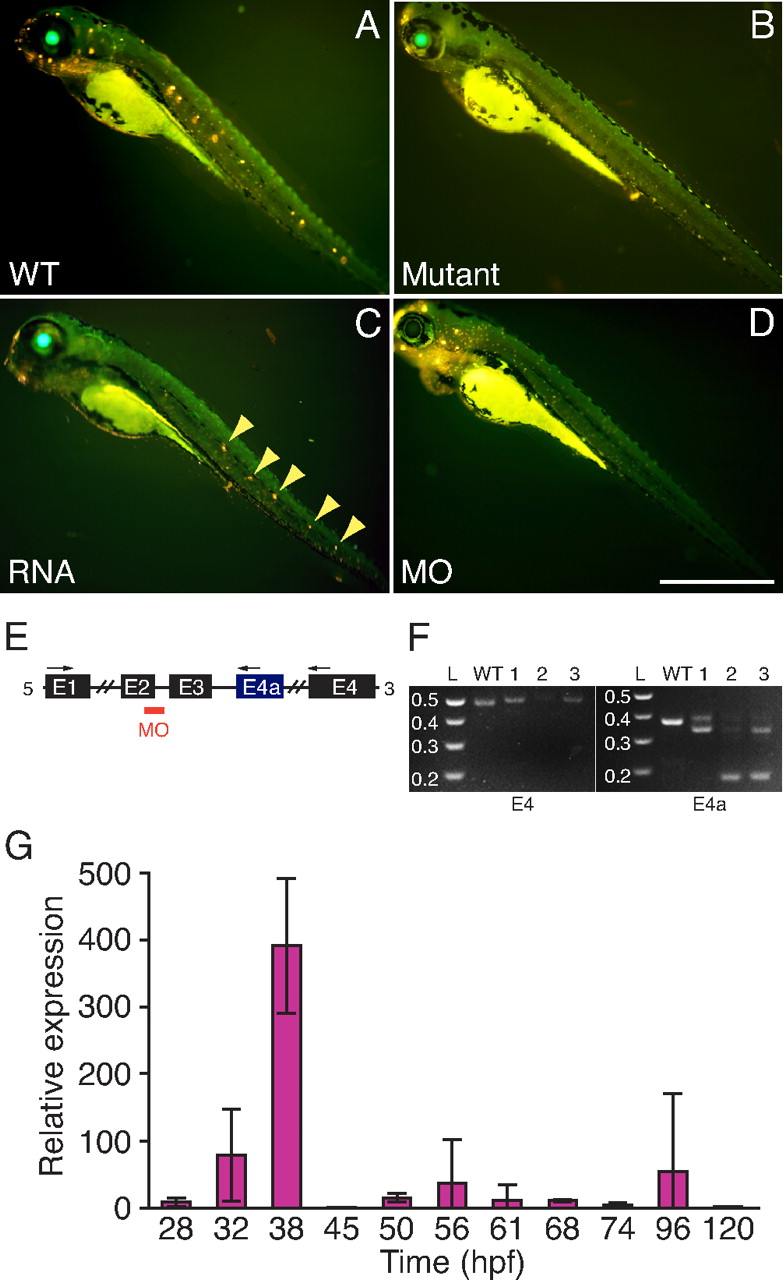
Fig. 4
Confirmation of the mutation. (A) Exposure of a WT 4-dpf larva to 4-Di-2-ASP (yellow) labels neuromasts. (B) Labeling is absent in a mutant. (C) Injection of capped RNA coding for normal Tmie partially rescues a mutant, restoring labeling in some neuromasts (arrowheads). (D) Injection of a WT embryo with a morpholino against tmie spares fluorophore incorporation in some neuromasts of the anterior lateral line but not in those of the posterior lateral line. (Scale bar, 500 μm.) (E) The morpholino (MO) targets the splice junction between exon 2 and intron 2. The arrows show the locations of the primers used to amplify the splicing products in RT-PCRs. (F) The RT-PCR products amplified from one WT and three morphant fish (1-3) confirm that the injected morpholino disrupts normal splicing of tmie (Left) and of its alternative transcript (Right), producing various aberrant products. L, DNA ladder in kilobases. (G) Endogenous expression of Tmie is sparse. The relative expression of tmie at different developmental stages was measured by qRT-PCR with RNA extracted from whole larvae. The results are presented as the mean and standard deviation of the ratio of each measurement to that at 24 hpf, the lowest value observed. Expression peaks at 38 hpf, declining sharply thereafter and remaining low through 120 hpf.