
|
Fig. 1
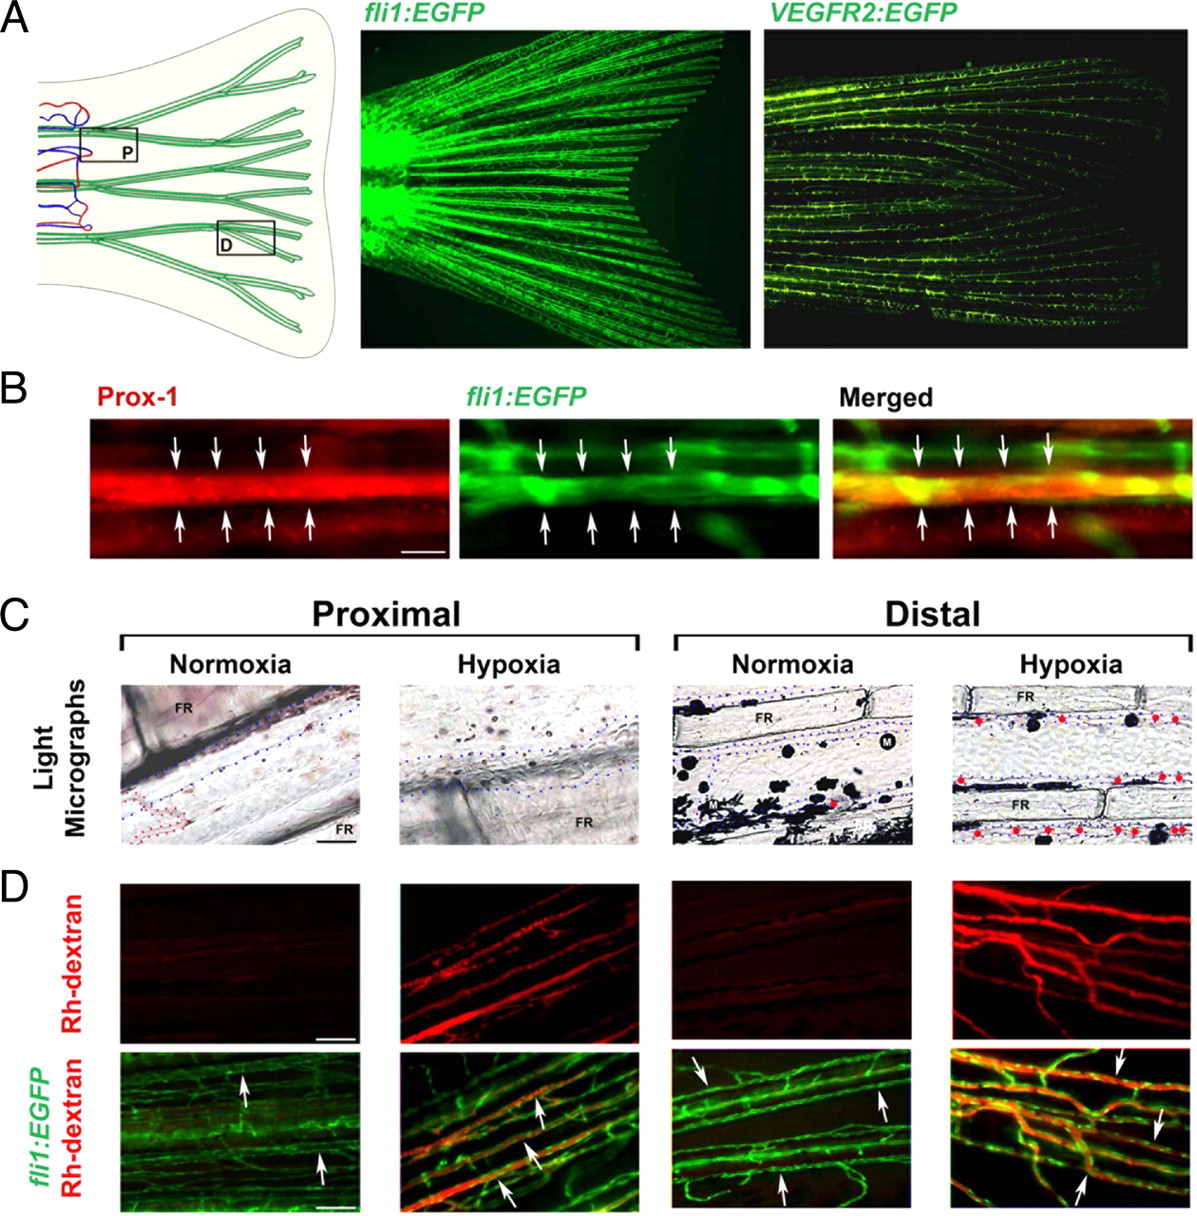
Hypoxia-induced lymphatic perfusion in the tailfin. (A) EGFP-positive signals in the tailfin of fli1:EGFP fish were compared with those in VEGFR2:EGFP fish. The tailfin of VEGFR2:EGFP zebrafish shows a subset of EGFP-positive structures as compared with those of fli1:EGFP zebrafish. Schematic presentation indicates the proximal (P) and distal (D) regions of the tailfin. Blue represents veins, red represents arteries, and green indicates lymphatic vessels. (B) Prox-1 immunohistochemical staining shows that a portion of the fli1:EGFP-positive vasculature is stained with prox-1 (red color, arrows). (Scale bar, 50 μm.) (C) Bright-field microscopic examination of proximal and distal regions of the tailfin under conditions of tissue normoxia and hypoxia. In both distal and proximal regions, hypoxia increases lymphatic dilation (diameters of vessels marked by blue dashed lines) and blood perfusion (blood cells in proximal region, marked with red dots in the distal region). FR, fin ray; M, melanocyte. (Scale bar, 50 μm.) (D) Hypoxia-induced rhodamine (Rh)-dextran perfusion in the lymphatic system of both proximal and distal regions. The bottom row of figures shows merged images of fli1:EGFP expression and Rh-dextran fluorescence. Arrows indicate lymphatic vessels. (Scale bar, 50 μm.)