
Image
|
Figure Caption
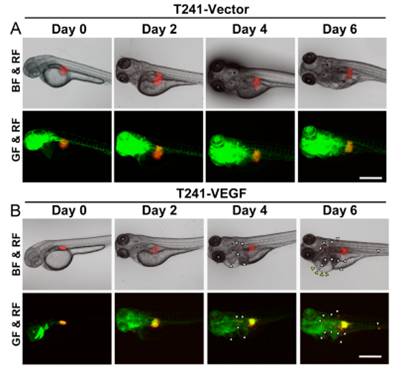
Fig. S3 Time-course analysis of invasion, dissemination and metastasis of T241-vector and T241-VEGF tumors. T241-vector and T241-VEGF tumor cells were implanted into the perivitelline space of each developing zebrafish embryo and dissemination and metastasis of DiI-labeled tumor cells were monitored by fluorescent microscopy on days 0, 2, 4, and 6. White arrowheads indicate disseminated tumor foci and yellow arrowheads indicate edema in the pericardium. (Scale bar, 500 μm.)
Acknowledgments
This image is the copyrighted work of the attributed author or publisher, and
ZFIN has permission only to display this image to its users.
Additional permissions should be obtained from the applicable author or publisher of the image.
Full text @ Proc. Natl. Acad. Sci. USA