
Image
|
Figure Caption
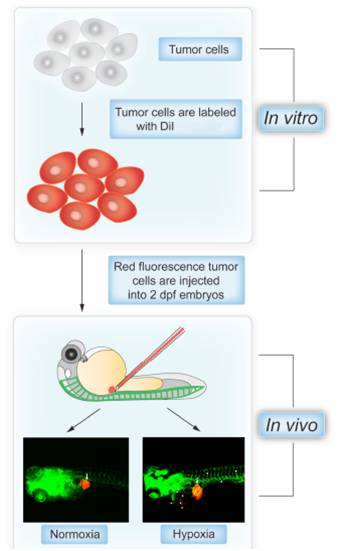
Fig. S1 Schematic diagram of zebrafish metastasis model under normoxia and hypoxia. Mammalian tumor cells were labeled with DiI dye in vitro and approximately 300 tumor cells in 5 nL DMEM are injected into the perivitelline space of each 48 h post-fertilization Tg(fli-1:EGFP) transgenic zebrafish embryo. Tumor cell invasion, dissemination, metastasis and angiogenesis were monitored in vivo in living fish body at different time points under normoxia and hypoxia (7.5% air saturation-the maximal tolerated oxygen tension) using fluorescent microscopy.
Acknowledgments
This image is the copyrighted work of the attributed author or publisher, and
ZFIN has permission only to display this image to its users.
Additional permissions should be obtained from the applicable author or publisher of the image.
Full text @ Proc. Natl. Acad. Sci. USA