
|
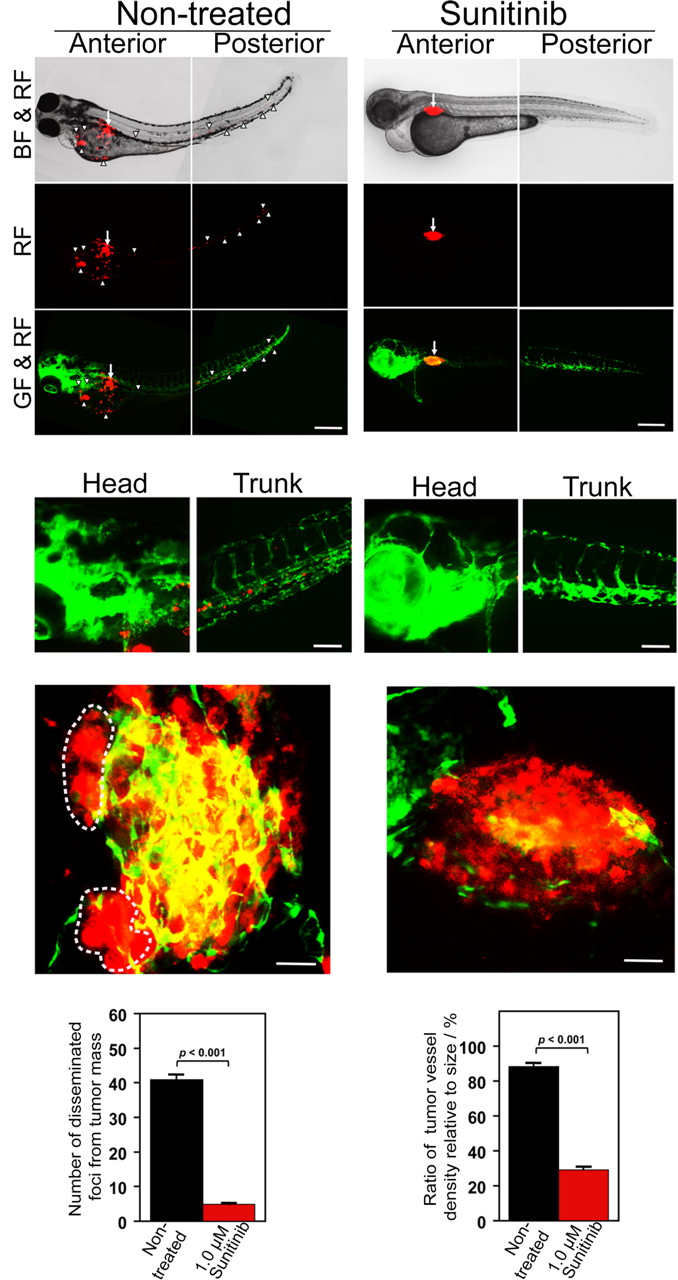
Fig. 6 Sunitinib inhibits hypoxia-induced invasion, dissemination and metastasis of T241 tumors. (A and D) DiI-labeled T241 tumor cells were implanted in the perivitelline space of 48 h post-fertilization embryos and shortly after injection zebrafish embryos were placed into a hypoxic chamber containing 7.5% air saturation, immediately followed by treatment with 1.0 μM sunitinib. Tumor cell invasion, dissemination and metastasis were detected at day 3 post-injection. Arrows indicate primary tumors and arrowheads indicate disseminated tumor foci. (Scale bar, 500 μm.) (B and E) High-resolution micrographs of A and D, respectively to visualize single metastatic tumor cells in the trunk regions. (Scale bar, 100 μm.) (C and F) Representative 3-D micrographs of confocal images of tumors (red) and tumor vasculatures (green). Dashed lines encircle invasive fronts of T241 tumors. (Scale bar, 10 μm.) (G) Quantification of numbers of disseminated tumor foci (n = 11/group). (H) Quantification of tumor vessel density relative to tumor sizes (n = 7/group). Data are represented as mean ± SEM.