
|
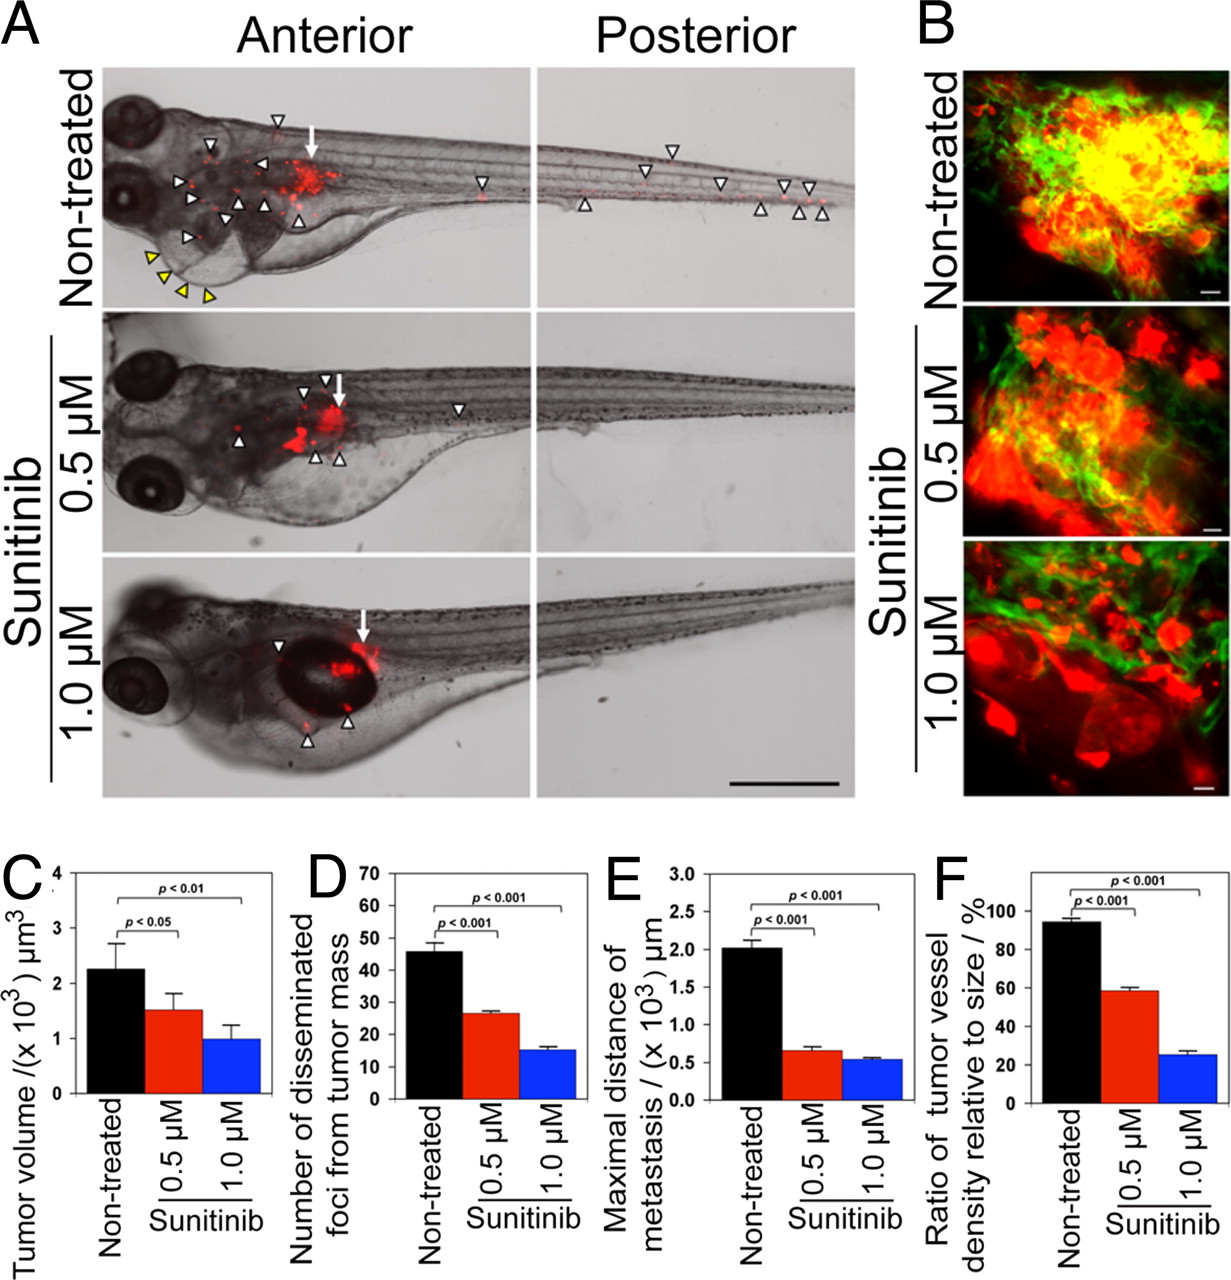
Fig. 4
Inhibition of tumor cell invasion, dissemination and metastasis by sunitinib. (A) Representative zebrafish embryos treated with or without 0.5 and 1.0 μM sunitinib. Arrows indicate primary tumors and arrowheads indicate disseminated and metastatic tumor cells in the distal parts of the fish body. (Scale bar, 500 μm.) (B) Representative 3-D micrographs of confocal images of tumors (red) and tumor vasculatures (green) in sunitinib-treated and non-treated groups. (Scale bar, 10 μm.) (C) Quantification of tumor volume (n = 10/group). (D) Quantification of disseminated tumor foci (n = 10/group). (E) Averages of maximal distances of metastatic foci (n = 10/group). (F) Quantification of tumor vessel density relative to tumor sizes (n = 7/group). Data are represented as mean ± SEM.