
|
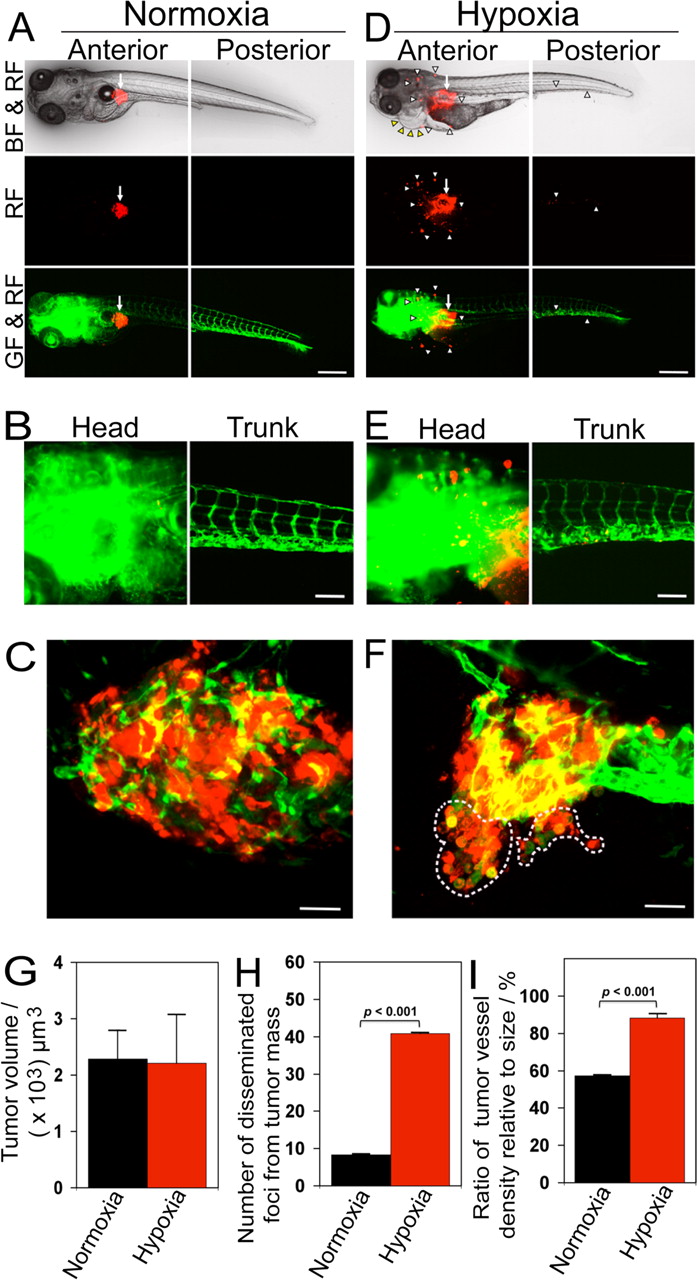
Fig. 1
Hypoxia promotes T241 tumor cell invasion, dissemination and metastasis. (A and D) DiI-labeled T241 tumor cells were injected into the perivitelline space of 48 h post-fertilization embryos and tumor cell invasion, dissemination and metastasis were detected under normoxia and hypoxia using fluorescent microscopy at day 3 post-injection. Arrows indicate primary tumors. Yellow arrowheads indicate pericardium edema. White arrowheads indicate disseminated tumor foci. (Scale bar, 500 μm.) (B and E) High-resolution micrographs of A and D, respectively. (Scale bar, 100 μm.) (C and F) Representative 3-D micrographs of confocal images of tumors (red) and tumoral as well as peritumoral vasculatures (green). Yellow signals show the intratumoral microvessels overlapping with tumor cells. Dashed lines encircle invasive fronts of T241 tumors under hypoxia. (Scale bar, 10 μm.) (G) Quantification of tumor volume (n = 13/group). (H) Quantification of numbers of disseminated tumor foci (n = 13/group). (I) Quantification of tumor vessel density relative to tumor sizes (n = 7/group). Data are represented as mean ± SEM.