
|
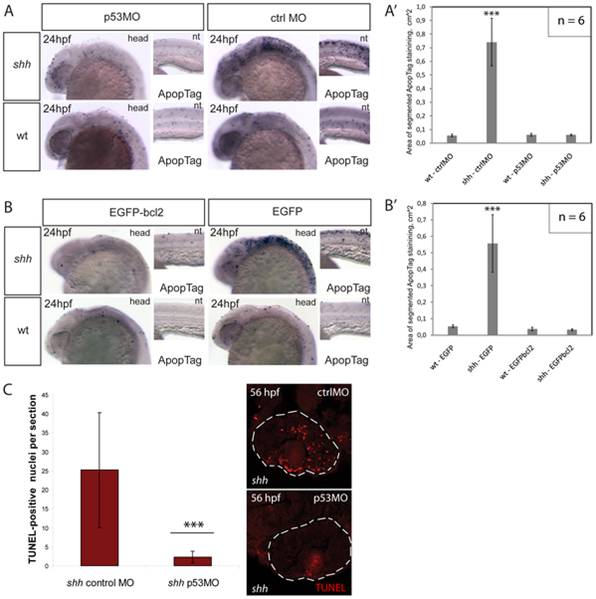
Fig. 2 (A) Apoptosis labelling using ApopTag staining in wild-type and shh-/- mutant embryos at 24 hpf after injection of p53 morpholino or control morpholino. The whole-mount images of the head (head) and neural tube (nt) are shown. (A′) Quantification of ApopTag signal area in wild-type and shh-/- mutant embryo head images from (A) shows that p53MO successfully decreased apoptosis in shh-/- mutant to the wild-type level. Asterisks (***) on top of the shh-/- mutant bar indicate its significant statistical differences from other samples (t-test, P-value<0,001). (B) Apoptosis labelling using ApopTag staining in wild-type and shh-/- mutant embryos at 24 hpf after injection of of EGFP-bcl2 or EGFP mRNA. The whole-mount images of the head (head) and neural tube (nt) are shown. (B′) Quantification of ApopTag signal area in wild-type and shh-/- mutant embryo head images from (B) shows that EGFP-bcl2 successfully decreased apoptosis in shh-/- mutant to the wild-type level. Asterisks (***) on top of the shh-/- mutant bar indicate its significant statistical differences from other samples (t-test, P-value<0,001). (C) Retinal apoptosis observed in shh-/- mutant at 56 hpf was suppressed by injection of p53 morpholino but not by injection of control morpholino (n = 10 and 40 sections for shh-/- mutant injected with p53 morpholino; n = 10 and 34 sections for shh-/- mutant injected with control morpholino). *** - t-test, P-value<0,001.