
Image
|
Figure Caption
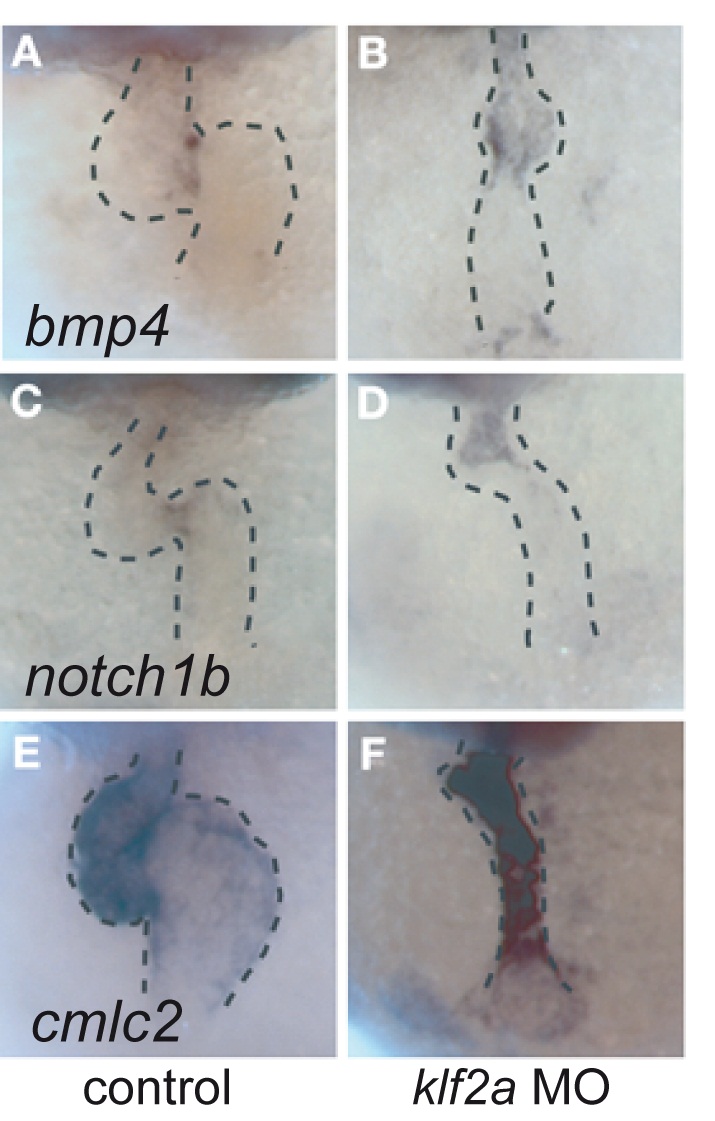
Fig. S8 Expression of notch1b, bmp4, and cmlc2 in control ([A, C, and E], respectively) and klf2a MO-treated ([B, D, and F], respectively) embryos. A strong phenotype after klf2a MO treatment is visible in a minority fraction of embryos treated with klf2a MO, which display immature heart growth (13%, n = 20). In these strongly affected embryos, the heart tube morphology is similar to that observed in conditions were blood flow is suppressed (see [7]); they were not used for flow analysis, qPCR, or for scoring valve morphogenesis at later stages.
Acknowledgments
This image is the copyrighted work of the attributed author or publisher, and
ZFIN has permission only to display this image to its users.
Additional permissions should be obtained from the applicable author or publisher of the image.
Full text @ PLoS Biol.