Image


                        Figure Caption


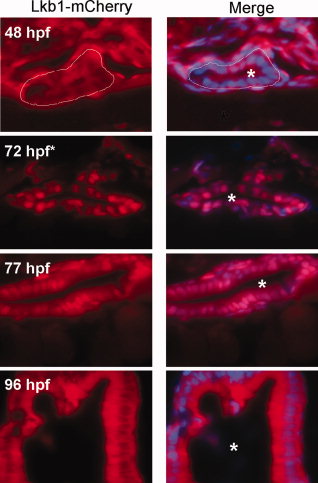
Fig. 4 Lkb1 displays dynamic subcellular localization during the EIT in zebrafish. Lkb1 subcellular localization was monitored in a Tg[β-actin: lkb1- mCherry] zebrafish line at 48 hpf, 72 hpf*, 77 hpf, and 96 hpf. Frozen sections were counterstained with DAPI (blue). A white line outlines the gut tube at 48 hpf, and asterisks mark the gut lumen. Original magnification: 630x.
                
                    
                        Figure Data


                        Acknowledgments


This image is the copyrighted work of the attributed author or publisher, and
ZFIN has permission only to display this image to its users.
Additional permissions should be obtained from the applicable author or publisher of the image.
      Full text @ Dev. Dyn.


        