
|
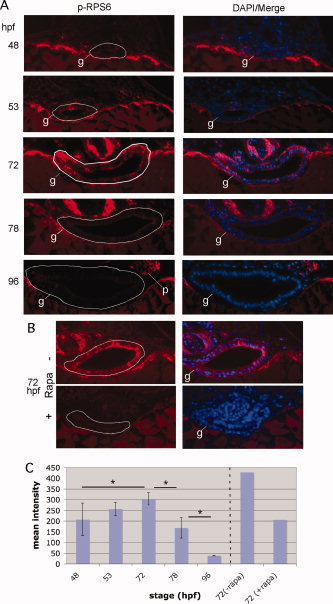
Fig. 1 TORC1 is transiently upregulated during the EIT in zebrafish. A: Zebrafish embryos were stained via whole mount immunofluorescence for P-RPS6ser240/244, followed by sectioning in JB-4 and counterstaining with DAPI. The white line delineates the gut epithelium (g). The number of immunopositive cells and staining increases from 48 to 72 hpf, then decreases upon cytodifferentiation of the epithelium. B: To verify that the fluorescent signal is a specific readout of TORC1, we treated embryos with 100 μM rapamycin for 24 hr prior to fixation. This resulted in significant reduction of the immunofluorescence signal. C: Mean fluorescence intensity (grayscale 0-4095) of the epithelium immunostained for P-RPS6ser240/244. Sections shown in A, as well as additional representative sections (total n=4 for each stage), were subjected to histometric analysis using the program Openlab to calculate the mean fluorescence intensity for the intestinal epithelium. For B, only the sections shown were subjected to analysis. *P < 0.05.