
IMAGE
Fig. 7
- ID
- ZDB-IMAGE-101104-57
- Genes
- Publication
- Aamar et al., 2010 - Sox17 and chordin are required for formation of Kupffer's vesicle and left-right asymmetry determination in zebrafish
- All Figures
- Figures for Aamar et al., 2010
Image
|
Figure Caption
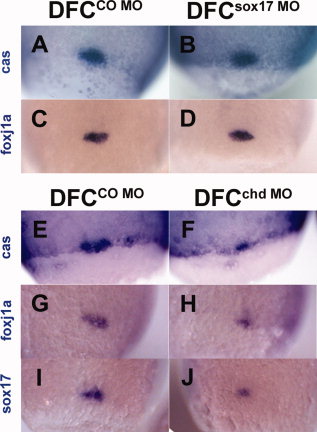
Fig. 7 DFC formation in embryos after targeted injection of sox17 MO or chd MO. In situ staining of cas (A,B,E,F), foxj1a (C,D,G,H), and sox17 (I,J) at the 80-90% epiboly stage after midblastula injection of 20 ng sox17 MO (B,D), 20 ng CO MO (A,C), 2.5 ng chd MO (F,H,J), or 2.5 ng CO MO (E,G,I). B and D show no reduction in DFC size whereas F, H, and J show size reduction; sox17 expression also appears reduced (J). All views are dorsal.
Figure Data
Acknowledgments
This image is the copyrighted work of the attributed author or publisher, and
ZFIN has permission only to display this image to its users.
Additional permissions should be obtained from the applicable author or publisher of the image.
Full text @ Dev. Dyn.