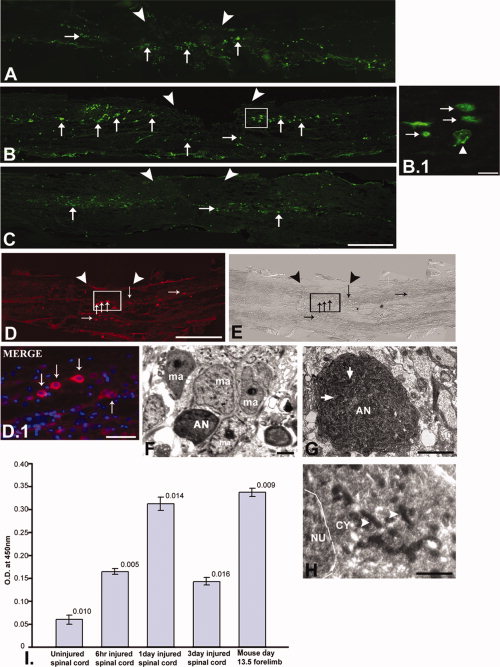
Fig. 8 TUNEL staining (A-C), caspase-3 immunohistochemistry (D-E), ultrastructural analysis (F-H), and quantification of caspase-3 (I) in injured zebrafish spinal cord. A: The 6-hr post-injured spinal cord section shows the presence of apoptotic TUNEL-positive cells (thin arrow) both at the injury epicenter (▼▼) and immediate adjacent part. B: The 1dpi cord shows many TUNEL-positive cells (thin arrow) close to the injury epicenter. B.1: The higher magnification picture of B shows many apoptotic cells (thin arrow) and a cell with fragmented nuclear matter (up white arrowhead). C: The 3dpi cord section shows less TUNEL-positive cells (thin arrow) compared to 1dpi cord. D, E: 1dpi cord section shows the presence of many caspase-3-positive apoptotic cells (thin arrow) at the injury epicenter with respective DIC. D.1: Higher magnification of same section shows some caspase-3-positive cells (thin arrow). F-H: Representative pictures of different apoptotic neurons in 3dpi cord, showing apoptotic neuron (AN) surrounded by macrophages (ma, F), another showing a fragmented nucleus (thick arrow) and retracted cytoplasm (G), and a third showing dying mitochondria (right white arrowhead) within the cytoplasm (H). I: Quantification of caspase-3 protein in uninjured and injured zebrafish spinal cord. Mouse day-13.5 forelimb represented positive control. Scale bar = 200 μm (A-E), 50 μm (D.1), 10 μm (B.1), 2 μm (F,G), 1 μm (H).
Image
Figure Caption
Acknowledgments
This image is the copyrighted work of the attributed author or publisher, and
ZFIN has permission only to display this image to its users.
Additional permissions should be obtained from the applicable author or publisher of the image.
Full text @ Dev. Dyn.

