
|
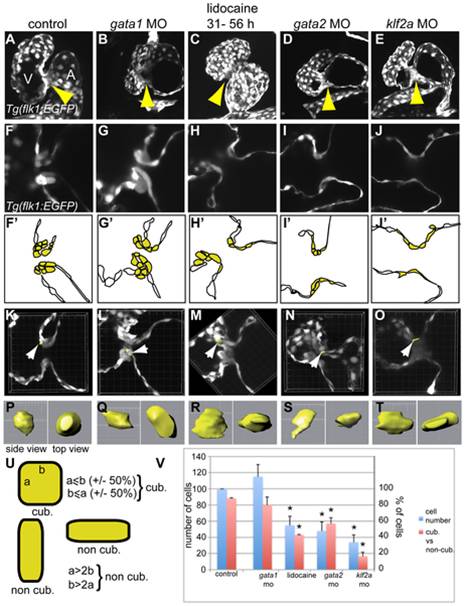
Fig. 5 Comparison of the valve phenotype between the different treatments affecting valvulogenesis in transgenic Tg(flk1:EGFP) zebrafish at 72 hpf.
GFP is expressed in the endothelial cell layer and highlights the developing valves. (A, F, and F′) control embryo, (B, G, and G′) gata1 morphant, (C, H, and H′) lidocaine treated, (D, I, and I′) gata2 morphant, and (E, J, and J′) klf2a morphant. Each treatment lead to an incomplete ingression of the endothelial cells in order to make a functional leaflet except in gata1 morphants. (F′-J′) Schematic representation of the panels (F-J) underlining the endothelial cells within valve-forming region (yellow) and the heart lumen (white). A, atrium; V, ventricle. (K–O) Three-dimensional reconstruction of 10 µm depth of the AV area in control (K), gata1 morphants (L), lidocaine-treated embryo (M), and gata2 (N) and klf2a (O) morphants. The white arrows point to the cell that has been reconstructed in three dimensions and which is presented in (P-T). (P-T) Side view (left) and top view (right) of a reconstructed cell of the AV canal. (U) Schematic drawing showing the approach used to define cuboidal versus non-cuboidal cell shape. (V) Graph summarizing the number of cells counted in the AV canal (corresponding to the yellow cells in [F′–J′]) (blue bars), and the ratio between cuboidal versus non cuboidal cell shape (red bars). Yellow arrows in (A-E) point to the endocardial ring.