
Fig. 2
|
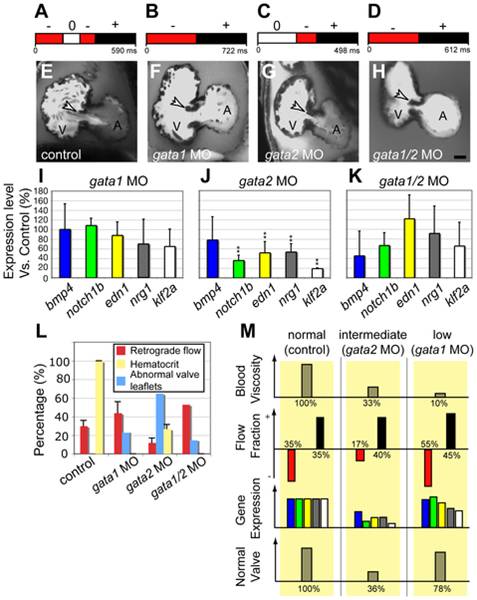
Fig. 2 Decreased retrograde flow via lowered blood viscosity affects valve morphogenesis.
(A–D) Flow pattern at 48 hpf in (A) control and after (B) gata1, (C) gata2, and (D) gata1/2 knock down. gata2 inactivation leads to a dramatic decrease in the RFF, whereas gata1 and gata1/2 knock downs exhibit increased RFF compared to the control. (E–H) Confocal sections of the valve-forming region in (E) control, (F) gata1, (G) gata2, and (H) gata1/2 morphants. Only gata2 morphants at 96 hpf show valve dysgenesis. Scale bar indicates 50 µm. (I–K) Quantitative RT-PCR showing the expression level of several flow-responsive genes after gata1, gata2, or gata1/2 knock down. **p<0.01, ANOVA. (L) Percentage of embryos displaying valve malformation at 96 hpf (red bar), hematocrit level (yellow bar), and RFF (blue bar) observed in morphants and controls at 48 hpf. The proportions were significantly different at a 10% level of significance (α = 0.1). (M) Outline summarizing the experimental outcome of manipulating oscillatory flow by decreasing circulating blood cells. The color code for gene expression is the same as in (I).