
Image
|
Figure Caption
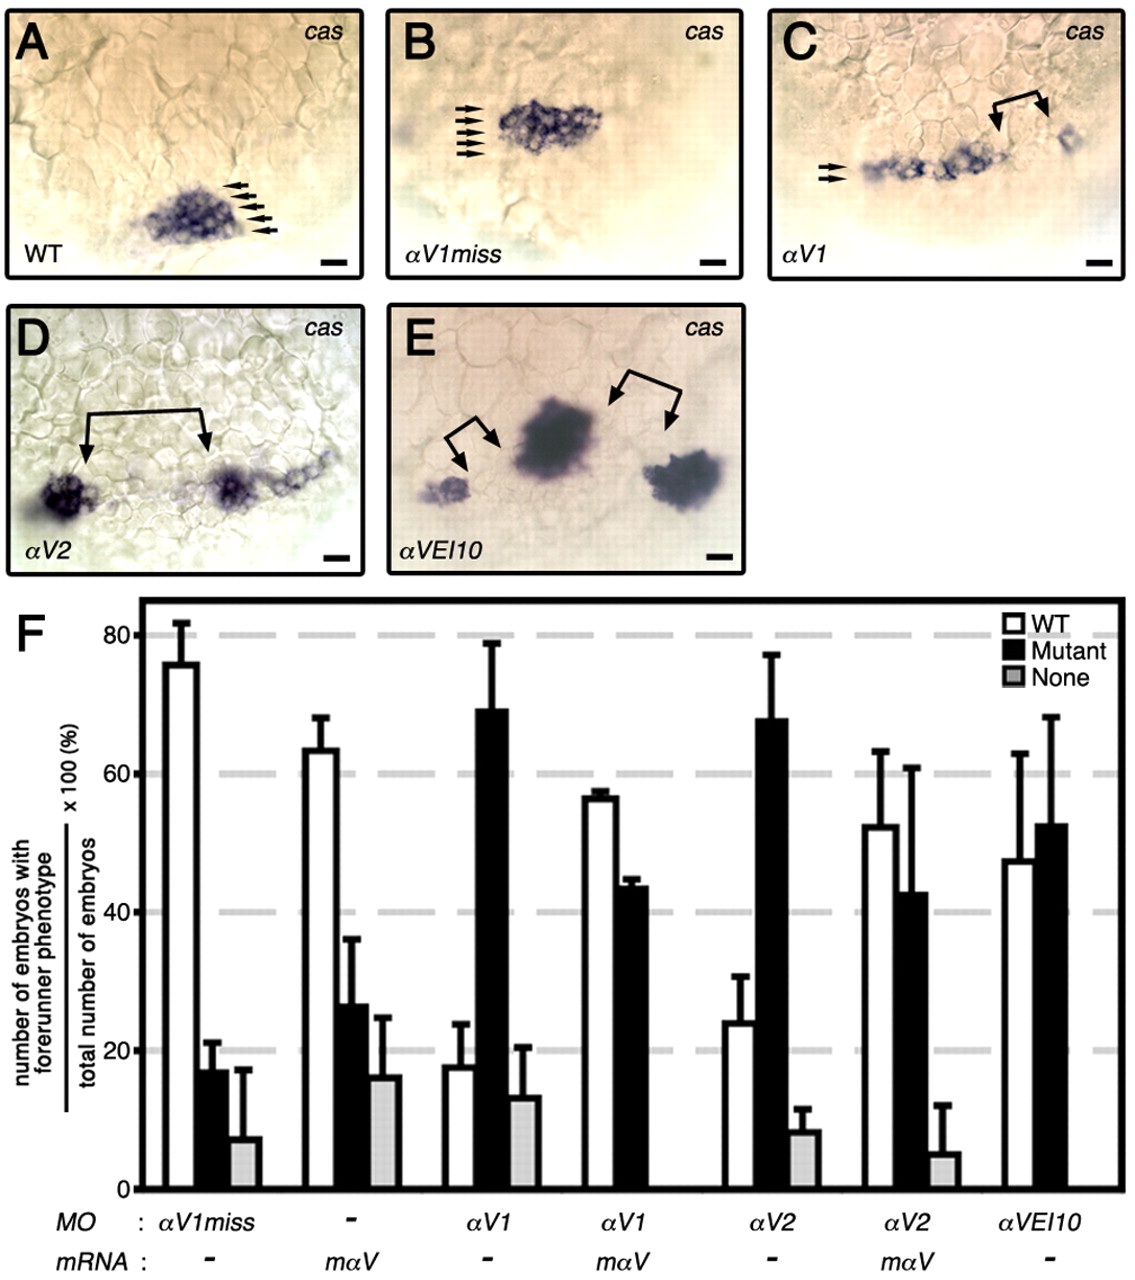
Fig. 3 Migratory DFCs are not properly formed in αV morphants. (A-E) Dorsal views of MO-injected embryos were slightly tilted to visualize cas expression (arrows, black) in DFCs at 80% E. Gaps in DFC field are indicated with bracketed arrows. (F) Bar graph showing scores from DFC phenotypes. Phenotypic classification of DFCs were as follows: Wild-type (WT), ovoid DFC cluster; mutant, a linear array of DFCs with occasional gaps; none, no visible DFCs. Data expressed are similar to those in Fig. 1E. Scale bars: 20 μm. See also Table S4 in the supplementary material.
Figure Data
Acknowledgments
This image is the copyrighted work of the attributed author or publisher, and
ZFIN has permission only to display this image to its users.
Additional permissions should be obtained from the applicable author or publisher of the image.
Full text @ Development