
Image
|
Figure Caption
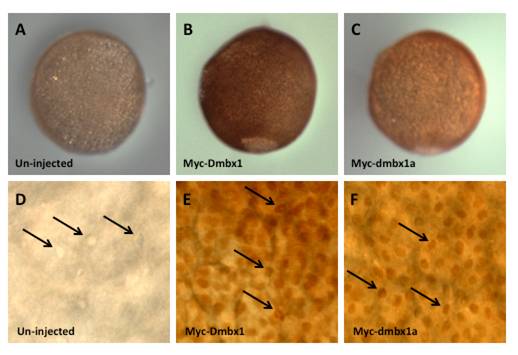
Fig. S8 Monitoring mouse Myc-Dmbx1 and zebrafish Myc-dmbx1a levels in vivo. Representative images of an (A) un-injected, (B) mouse myc-Dmbx1 mRNA injected (400 pg), and (C) zebrafish myc-dmbx1a mRNA injected (150 pg) tailbud stage embryo (lateral view) processed for whole-mount immunolabeling using an anti-Myc antibody (n = 10 per group). Panels D-F are representative high magnification images of embryos in each of the three treatment groups; black arrows indicate nuclei that are DAB+ in the injected groups, but lack DAB staining in the un-injected group.
Acknowledgments
This image is the copyrighted work of the attributed author or publisher, and
ZFIN has permission only to display this image to its users.
Additional permissions should be obtained from the applicable author or publisher of the image.
Full text @ BMC Dev. Biol.