
|
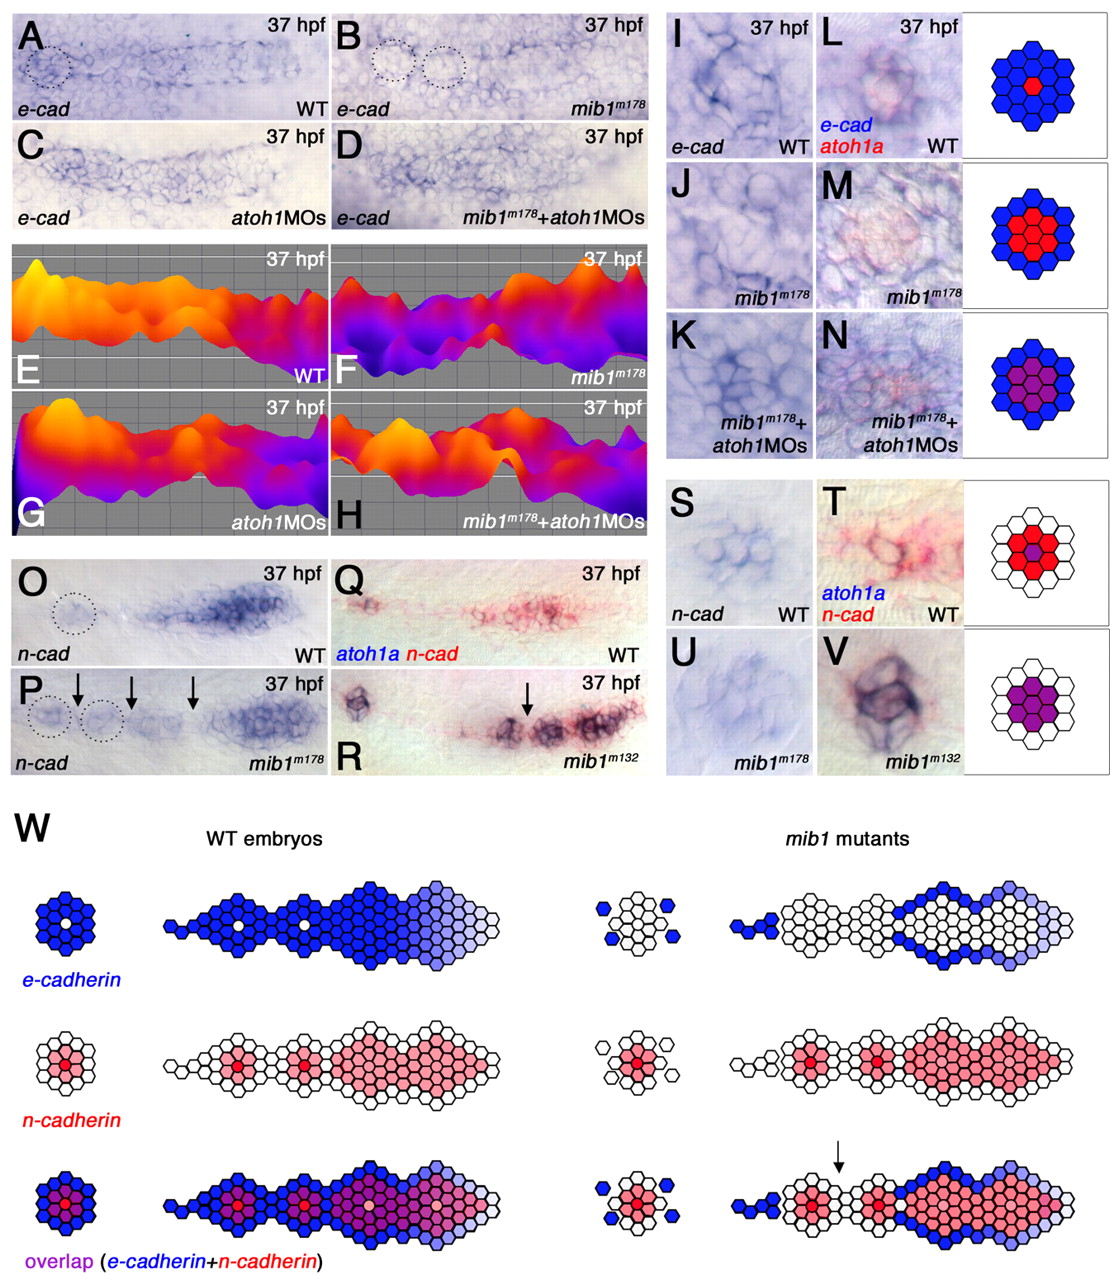
Fig. 7 Changes in pLLp cohesion correlate with changes in Cadherin gene expression. (A-N) e-cadherin expression in the pLLp (A-H) and deposited proneuromasts (I-N) at <37 hpf. (E-H) Color-coded representations of the e-cadherin expression shown in A-D, created using the interactive three-dimensional surface plot plug-in from ImageJ (Abramoff et al., 2004). (A,E) In wild-type, e-cadherin is broadly expressed, being lower at the leading and higher at the trailing proneuromasts prior to deposition. (B,F) e-cadherin expression is suppressed in the pLLp trailing domain of mib1m178 zebrafish embryos (n=8). Dotted circles in B represent domains of suppressed e-cadherin expression. (C,G) atoh1MOs do not substantially alter e-cadherin expression in wild-type embryos (n=7). (D,H) Higher e-cadherin expression in the trailing pLLp is restored in mib1m178+atoh1MOs embryos (n=12). (I,L) e-cadherin expression (blue) is generally more intense, but absent in a central atoh1a-expressing cell (red), in deposited neuromasts (n=6). (J,M) The central atoh1a-expressing domain expands at the cost of e-cadherin in mib1m178 deposited neuromasts (n=6). (K,N) Knockdown of atoh1 in mib1m178 expands e-cadherin expression and allows overlap (purple) with atoh1a (n=13). (O-V) n-cadherin expression in the pLLp (O-R) and deposited proneuromasts (S-V). (O,Q) In wild type, n-cadherin is broadly expressed at the leading end but becomes restricted at the trailing end, prior to neuromast deposition. (P,R) In mib1m178 pLLp, n-cadherin expression is not significantly different from that of wild type. Dotted circles highlight an example of expanded expression of n-cadherin in isolated groups of cells, which are likely to represent prematurely deposited proneuromasts from a recently fragmented pLLp. (Q,R,T,V) Double in situ hybridization showing atoh1a (blue) and n-cadherin (red) expression. (S-V) In deposited neuromasts, n-cadherin expression is similar in wild type (S,T) and mib1 mutants (U,V). In wild type, a central cell expressing atoh1a and n-cadherin (purple in T) is surrounded by cells expressing only n-cadherin (red in T). In mib1 mutants, atoh1a expands and overlaps with n-cadherin (purple in V). (W) The pLLp and neuromasts normally contain cells that express e-cadherin (blue) or n-cadherin (red). Intervening cells expressing both e-cadherin and n-cadherin (purple) provide an adhesive link between cells that express distinct cadherins. When Notch signaling fails, atoh1a expression expands and e-cadherin is lost from intervening cells that would otherwise express both Cadherin genes. As e-cadherin- and n-cadherin-expressing populations are now unable to establish effective adhesive interactions, the pLLp fragments. Arrow indicates predicted point of fragmentation.