
Image
|
Figure Caption
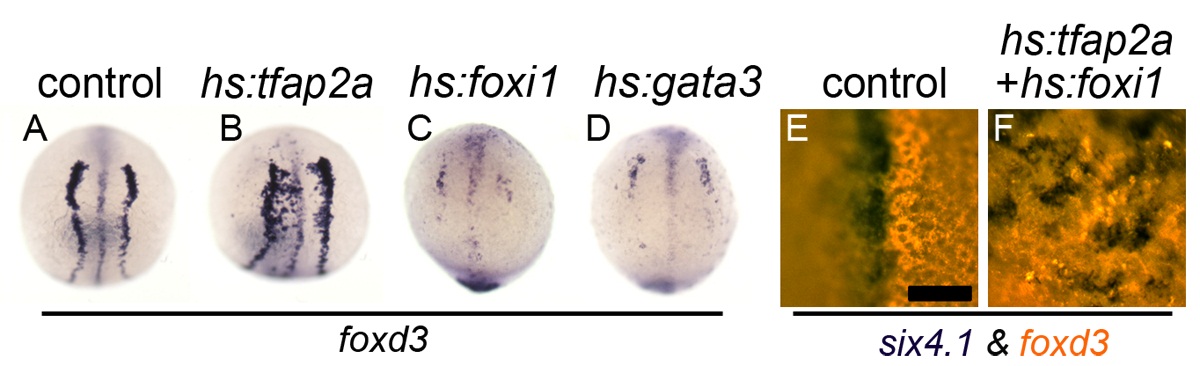
Fig. S4 Effect of misexpression of competence factors on neural crest development. (A–D) Expression of foxd3 at 11 hpf in a control embryo (A), or following activation of hs:tfap2a (B), hs:foxi1 (C) or hs:gata3 (D) at 4.5 hpf. (E, F) Expression of six4.1 (blue) and foxd3 (red, fluorescence) in a control embryo (E) or following activation of hs:tfap2a and hs:foxi1 at 4.5 hpf (F). Scale bar = 50 µm.
Acknowledgments
This image is the copyrighted work of the attributed author or publisher, and
ZFIN has permission only to display this image to its users.
Additional permissions should be obtained from the applicable author or publisher of the image.
Full text @ PLoS Genet.