
|
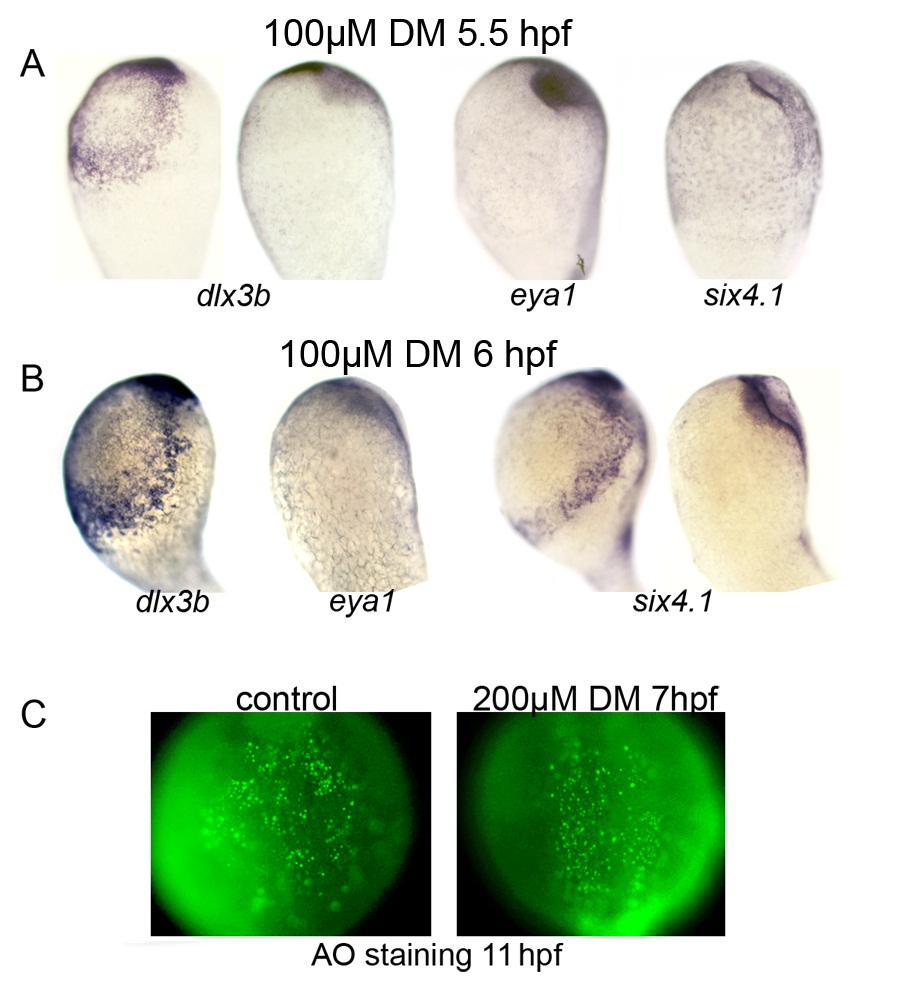
Fig. S2 Additional data showing the effects of DM on preplacodal development and cell survival. (A, B) Expression of preplacodal markers at 10.5 hpf following addition of 100 µM DM at 5.5 hpf or 6 hpf. Treatment at 5.5 hpf eliminated expression of eya1 and six4.1, whereas dlx3b was either lost or expressed in bilateral stripes (the specimens processed for dlx3b expression were from the same experiment). Treatment at 6 hpf yielded two classes of embryos, with some showing loss of preplacodal markers and others showing bilateral stripes of preplacodal markers (the two specimens processed for six4.1 expression were from the same experiment). (C) Dorsal views of embryos stained with acridine orange (AO) at 11 hpf following addition of DMSO (control) or 200 µM DM at 7 hpf. AO staining in is comparable in controls and DM-treated embryos. At least 20 specimens were examined for each marker and time point.