
|
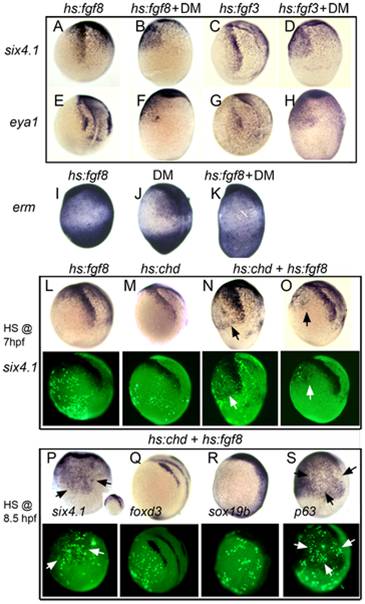
Fig. 7 The entire nonneural ectoderm is competent to form preplacodal tissue.
(A–H) Expression of preplacodal markers in (A, B, E, F) Tg(hs:fgf8) embryos incubated at 35°C from 7.5–10.5 hpf, or (C, D, G, H) Tg(hs:fgf3) embryos incubated at 36°C from 7–10.5 hpf. 100 µM DM was added as indicated. (I–K) Expression of erm in (I) Tg(hs:fgf8) embryo incubated at 35°C without DM, (J) a non-transgenic embryos incubated at 35°C with 100 µM DM, and (K) a Tg(hs:fgf8) embryo incubated at 35°C with 100 µM DM. (L–S) Mosaic misexpression of Fgf8 and/or Chordin. (L–O) Brightfield images (top row) and fluorescent images (bottom row) of host embryos with cells transplanted from Tg(hs:fgf8) (L), Tg(hs:chd) (M) or Tg(hs:fgf8); Tg(hs:chd) donor embryos (N, O). Donor embryos were injected with lineage tracer (biotin-dextran) and transplanted at mid-blastula (L, M, N) or early gastrula stage (O) into unlabeled host embryos. Embryos were heat-shocked at 39°C for 30 minutes at 7 hpf and examined for six4.1 expression at 10.5 hpf. Transplanted transgenic cells were identified by Strepavidin-FITC staining after in situ hybridization. All panels show lateral views of host embryos with anterior up. Mosaic embryos with Tg(hs:fgf8);Tg(hs:chd) double transgenic cells showed ectopic six4.1 expression in surrounding ventral ectoderm (N, O), whereas no ectopic six4.1 expression was detected following activation of hs:fgf8 alone (L) or hs:chd alone (M). (P–S) Brightfield images (top row) and fluorescent images (bottom row) of host embryos with cells transplanted during early gastrula stage from double heterozygous Tg(hs:fgf8); Tg(hs:chd) embryos. Embryos were heat shocked for 30 minutes at 39°C beginning at 8.5 hpf and examined for expression of six4.1 (preplacodal ectoderm), foxd3 (neural crest), sox19b (neural plate) or p63(epidermal ectoderm) at 10.5 hpf. All panels show lateral views except (P) which shows a ventral view (lateral view in inset) and (S) which shows ventro-lateral view. Heat shock activation at 8.5 hpf (P) leads to stronger ectopic expression of six4.1 than heat shock at 7 hpf (O). No ectopic expression of foxd3 or sox19b is detected (Q, R) whereas p63 expression appears downregulated in and around transgenic cells (arrows in S).