
|
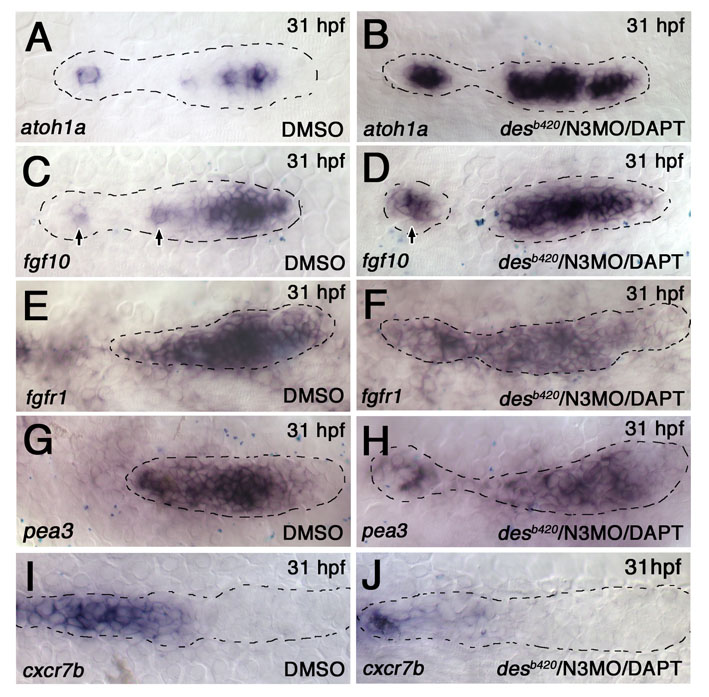
Fig. S7 fgf10 expansion and complementary loss of fgfr1 expression and FGF-dependent gene expression in desb420/N3MO/DAPT embryos. Expression of atoh1a, fgf10, fgfr1, pea3, and cxcr7b in desb420/N3MO/DAPT embryos. (A) atoh1a expression in a wild-type pLLp is broad at the leading end but restricted to a single cell in the trailing end (arrows) (n=10/10). (B) atoh1a expression expands at the trailing end and in deposited neuromasts (arrow) in the desb420/N3MO/DAPT embryos (n=7/7). (C) fgf10 expression in a wild-type pLLp is broad at the leading end but restricted to a single cell in the trailing end (arrows) (n=7/7). (D) fgf10 expression expands at the trailing end and in deposited neuromasts (arrow) in the desb420/N3MO/DAPT embryos (n=9/9). (E,F) fgfr1 is broadly expressed in control DMSO-treated embryos. The fgfr1-negative cell at the center is hard to see in this example. The central fgfr1-negative domain expands in desb420/N3MO/DAPT embryos, as seen in the trailing neuromast in this example (n=8/8). (G,H) pea3 expression is reduced in desb420/N3MO/DAPT embryos compared with DMSO-treated control embryos (n=6/7). (I,J) cxcr7b expression is reduced in desb420/N3MO/DAPT embryos (n=6/6).