
|
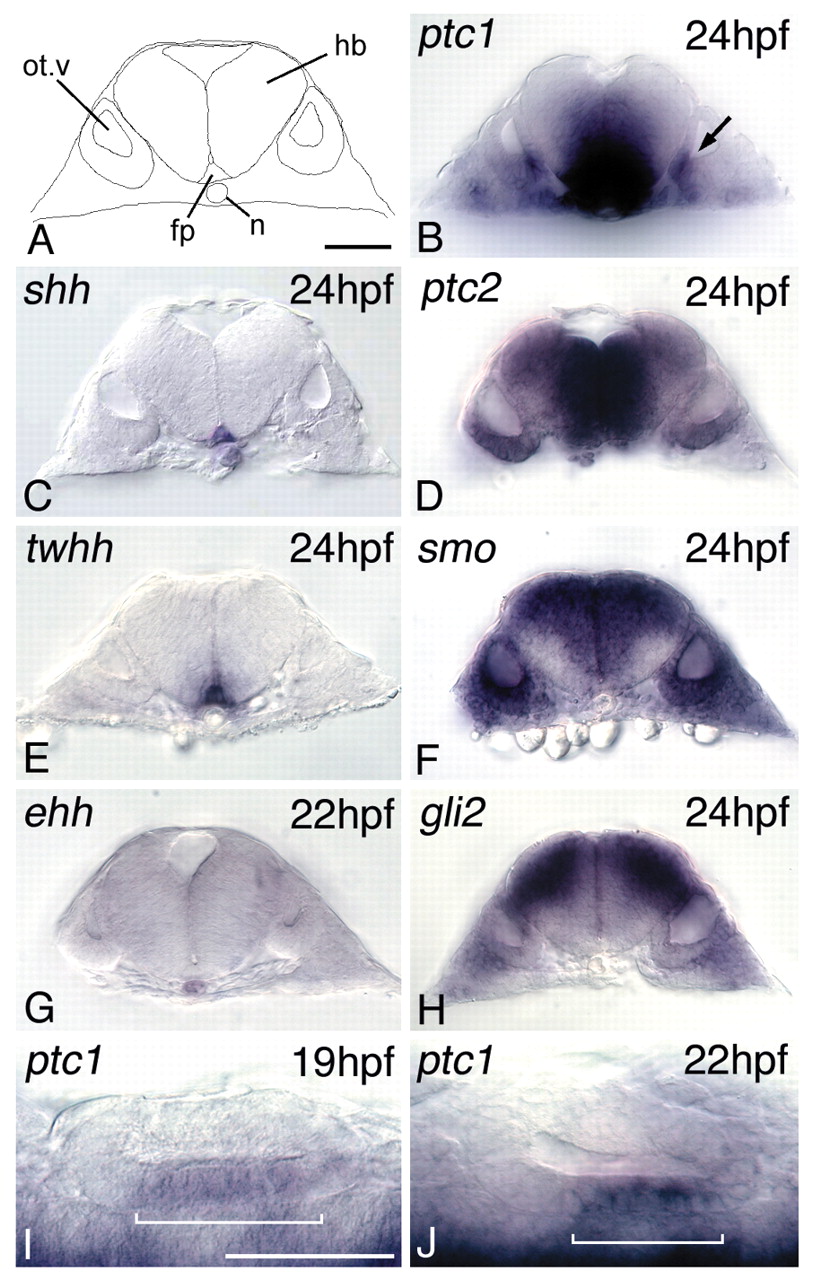
Fig. 1 Expression of Hedgehog pathway components in the zebrafish otic vesicle. (A) Tracing of transverse section, outlining relevant tissues: ot.v, otic vesicle; fp, floorplate; n, notochord; hb, hindbrain. Dorsal towards the top. Scale bar: 50 μm. (B-H) Transverse, hand cut sections of whole-mount in situ hybridisation. Note that midline sources of Hedgehog are approximately 40 μm from the otic vesicle; shh is expressed in both the floorplate and notochord (C), twhh in just the floorplate (E) and ehh in just the notochord (G). Factors necessary for transduction of the Hh signal are expressed within the otic vesicle; ptc1 is expressed in a ventromedial domain (arrow, B), ptc2 throughout ventral otic regions (D) and smo throughout the entire vesicle (F). gli2 is not, however, highly expressed in the developing ear (H). (I,J) Dorsal views of whole-mount otic vesicle preparations. Anterior towards the left, lateral towards the top. Scale bar: 50 μm. At 19 hpf (I), ptc1 is expressed throughout the ventromedial otic vesicle but by 22 hpf (J) is concentrated in posterior regions (brackets).