
Image
|
Figure Caption
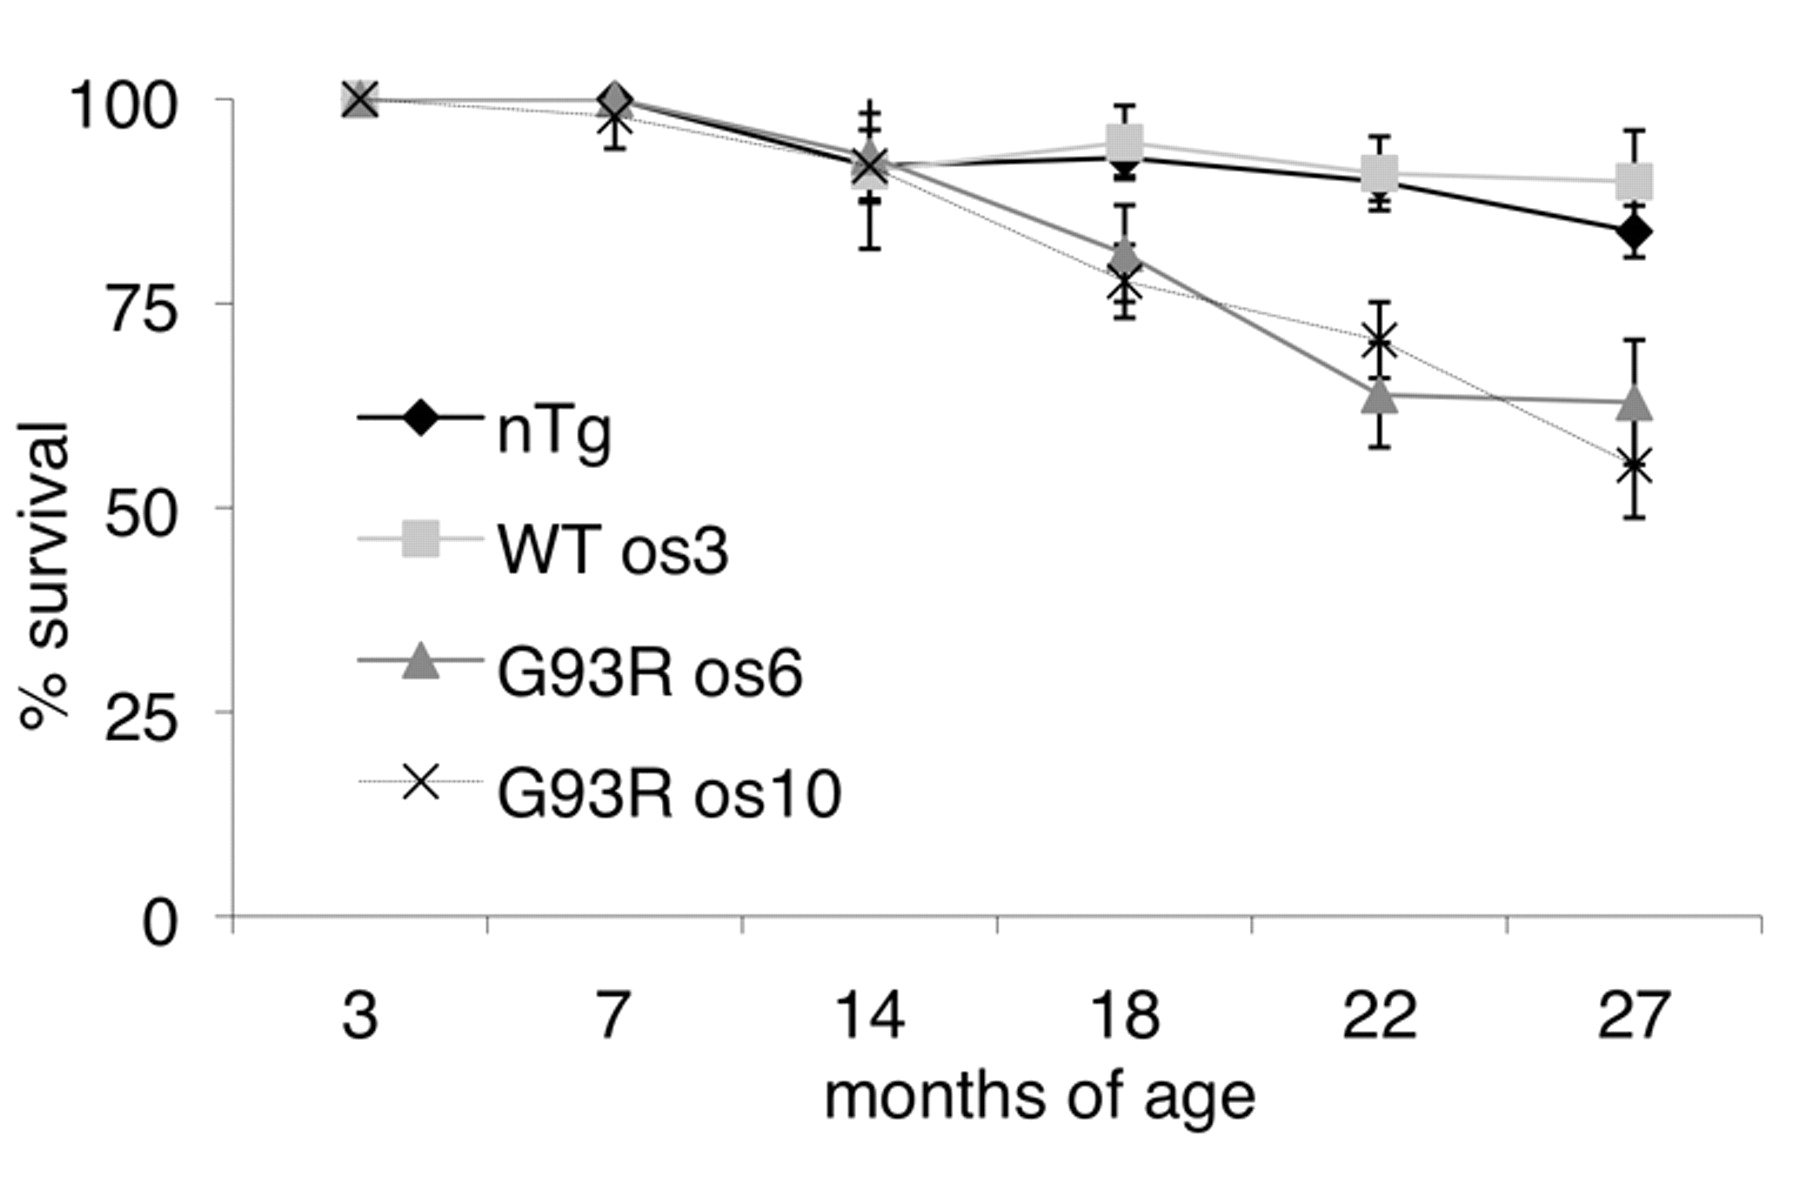
Fig. 7 G93R mutant fish have reduced survival. The percentage of surviving fish ± 95% confidence intervals is shown. To track the survival of more than 1000 fish, the numbers of fish were routinely counted. Each time fish were counted, they were placed into an age bracket: 7±2, 14±2, 18±1, 22±2 and 27±2 months of age. At any given age, several independent clutches of fish were counted for each line. See Materials and methods for details on the number of fish counted for each line at each age bracket.
Figure Data
Acknowledgments
This image is the copyrighted work of the attributed author or publisher, and
ZFIN has permission only to display this image to its users.
Additional permissions should be obtained from the applicable author or publisher of the image.
Permissions updated 10/14/2010.
Full text @ Dis. Model. Mech.